Please wait a minute...
Fig/Tab
Rss
Email Alert
Adv Search
Home
About Journal
Editorial Board
Publishing Ethics
Subscriptions
Advertise
Contact Us
Download
中文
Introduction
Indexed-in
Journal Metrics
大事记
-->
IMAGE/TABLE DETAILS
Experimental study on the performance of multi-stage reverse electrodialysis based on LiCl-NH
4
Cl aqueous solution
Junyong HU, Yali HU, Xueyi TAN, Jiaxin HUANG, Lewei ZHANG, Junli ZENG, Xiaoyi LIU, Yuan TAO
CIESC Journal
DOI:
10.11949/0438-1157.20240198
型号
材料
厚度
δ
×
10
4
m
开孔面积
孔隙率
ε
DPP32
PET
1.50
68%
79.2%
Table 3
Relevant parameters of the spacers
Other Images/Table from this Article
Fig. 1
Schematic diagram of the series control MSREDH
Table 1 Specific information of experimental reagents
Table 2 Basic parameters of Fujifilm IEMs
Table 4 Relevant parameters of experimental equipment and instruments
Fig.2
Schematic diagram of experimental process
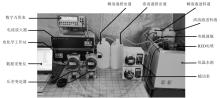
Fig.3
Photograph of experimental system
Table 5 Variation range of experimental parameters
Fig. 4
Variations of the total net output power with the number of RED stacks under different current densities (
i
d
) ( The operating conditions of experiments:
i
d
=20 A·m
-2
, 40 A·m
-2
, 60 A·m
-2
, 80 A·m
-2
;
m
HC
=4 mol·kg
-1
,
m
LC
= 0.05 mol·kg
-1
;
t
= 25±1°C;
v
= 1.0 cm·s
-1
)
Table 6 Comparison of pertinent performance data for MSRED
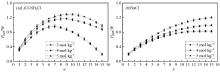
Fig. 5
Variations of the total net output power with the number of RED stacks under different molality concentration of HC feed solution (
m
HC
) ( The operating conditions of experiments:
m
HC
= 3 mol·kg
-1
, 4 mol·kg
-1
, 5 mol·kg
-1
,
m
LC
= 0.05 mol·kg
-1
;
t
= 25±1°C;
v
= 1.0 cm·s
-1
; the current density
i
d
in Fig. 5 (a) and (b) are 80 A·m
-2
and 40 A·m
-2
, respectively)
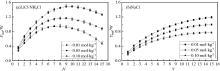
Fig. 6
Variations of the total net output power with the number of RED stacks under different molality concentration of LC feed solution (
m
LC
) ( The operating conditions of experiments:
m
HC
= 4 mol·kg
-1
,
m
LC
= 0.01 mol·kg
-1
,0.05 mol·kg
-1
,0.1 mol·kg
-1
;
t
= 25±1°C;
v
= 1.0 cm·s
-1
; the current density
i
d
in Fig. 6 (a) and (b) are 80 A·m
-2
and 40 A·m
-2
, respectively )
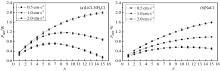
Fig.7
Variations of the total net output power with the number of RED stacks under different flow velocity (
v
) ( The operating conditions of experiments:
m
HC
= 4 mol·kg
-1
,
m
LC
= 0.05 mol·kg
-1
;
t
= 25±1°C;
v
= 0.5 cm·s
-1
, 1 cm·s
-1
, 2 cm·s
-1
; the current density
i
d
in Fig. 7(a) and (b) are 80 A·m
-2
and 40 A·m
-2
, respectively)