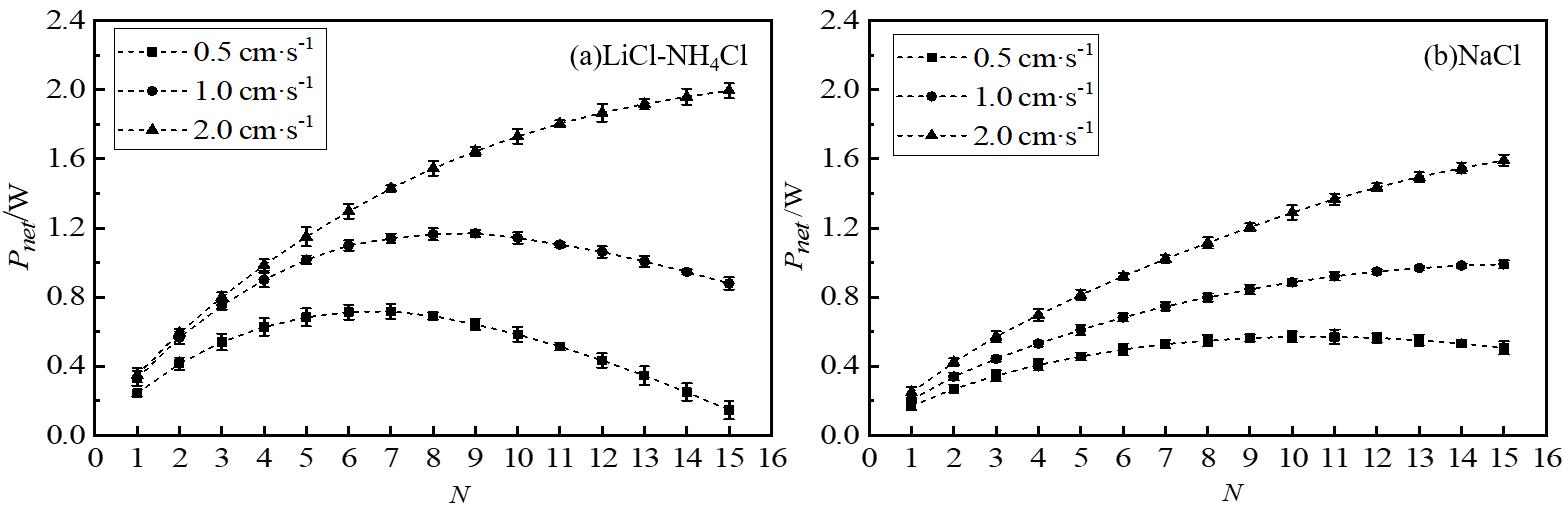
Fig.7
Variations of the total net output power with the number of RED stacks under different flow velocity (v) ( The operating conditions of experiments: mHC = 4 mol·kg-1, mLC = 0.05 mol·kg-1; t = 25±1°C; v = 0.5 cm·s-1, 1 cm·s-1, 2 cm·s-1; the current density id in Fig. 7(a) and (b) are 80 A·m-2 and 40 A·m-2, respectively)
Other Images/Table from this Article
-
 Fig. 1
Schematic diagram of the series control MSREDH
Fig. 1
Schematic diagram of the series control MSREDH
-
 Table 1
Specific information of experimental reagents
Table 1
Specific information of experimental reagents
-
Table 2
Basic parameters of Fujifilm IEMs
-
Table 3
Relevant parameters of the spacers
-
Table 4
Relevant parameters of experimental equipment and instruments
-
 Fig.2
Schematic diagram of experimental process
Fig.2
Schematic diagram of experimental process
-
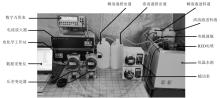 Fig.3
Photograph of experimental system
Fig.3
Photograph of experimental system
-
Table 5
Variation range of experimental parameters
-
 Fig. 4
Variations of the total net output power with the number of RED stacks under different current densities (id ) ( The operating conditions of experiments: id =20 A·m-2, 40 A·m-2, 60 A·m-2, 80 A·m-2; mHC =4 mol·kg-1, mLC = 0.05 mol·kg-1; t = 25±1°C; v = 1.0 cm·s-1)
Fig. 4
Variations of the total net output power with the number of RED stacks under different current densities (id ) ( The operating conditions of experiments: id =20 A·m-2, 40 A·m-2, 60 A·m-2, 80 A·m-2; mHC =4 mol·kg-1, mLC = 0.05 mol·kg-1; t = 25±1°C; v = 1.0 cm·s-1)
-
Table 6
Comparison of pertinent performance data for MSRED
-
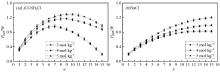 Fig. 5
Variations of the total net output power with the number of RED stacks under different molality concentration of HC feed solution (mHC ) ( The operating conditions of experiments: mHC = 3 mol·kg-1, 4 mol·kg-1, 5 mol·kg-1, mLC = 0.05 mol·kg-1; t = 25±1°C; v = 1.0 cm·s-1; the current density id in Fig. 5 (a) and (b) are 80 A·m-2 and 40 A·m-2, respectively)
Fig. 5
Variations of the total net output power with the number of RED stacks under different molality concentration of HC feed solution (mHC ) ( The operating conditions of experiments: mHC = 3 mol·kg-1, 4 mol·kg-1, 5 mol·kg-1, mLC = 0.05 mol·kg-1; t = 25±1°C; v = 1.0 cm·s-1; the current density id in Fig. 5 (a) and (b) are 80 A·m-2 and 40 A·m-2, respectively)
-
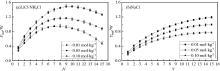 Fig. 6
Variations of the total net output power with the number of RED stacks under different molality concentration of LC feed solution (mLC ) ( The operating conditions of experiments: mHC = 4 mol·kg-1, mLC = 0.01 mol·kg-1,0.05 mol·kg-1,0.1 mol·kg-1; t = 25±1°C; v = 1.0 cm·s-1; the current density id in Fig. 6 (a) and (b) are 80 A·m-2 and 40 A·m-2, respectively )
Fig. 6
Variations of the total net output power with the number of RED stacks under different molality concentration of LC feed solution (mLC ) ( The operating conditions of experiments: mHC = 4 mol·kg-1, mLC = 0.01 mol·kg-1,0.05 mol·kg-1,0.1 mol·kg-1; t = 25±1°C; v = 1.0 cm·s-1; the current density id in Fig. 6 (a) and (b) are 80 A·m-2 and 40 A·m-2, respectively )
|

