化工学报 ›› 2022, Vol. 73 ›› Issue (11): 4850-4858.DOI: 10.11949/0438-1157.20220811
彭昌炜1( ), 桑世华1(), 崔瑞芝2,3, 任红保1
收稿日期:2022-06-10
修回日期:2022-09-29
出版日期:2022-11-05
发布日期:2022-12-06
通讯作者:
桑世华
作者简介:彭昌炜(1998—),男,硕士研究生, 2832975774@qq.com
基金资助:
Changwei PENG1(), Shihua SANG1(), Ruizhi CUI2,3, Hongbao REN1
Received:2022-06-10
Revised:2022-09-29
Online:2022-11-05
Published:2022-12-06
Contact:
Shihua SANG
摘要:
为合理开发四川盆地富溴地下卤水资源,对五元体系NaBr-KBr-MgBr2-CaBr2-H2O进行了298.15 K条件下完整的相平衡与相图的研究。根据实验测定的溶解度数据,绘制出了完整的空间立体相图,NaBr·2H2O、MgBr2·6H2O和CaBr2·6H2O三种盐饱和面的干基投影相图,以及相应的含水量图。研究结果表明该五元体系在298.15 K下的空间立体相图中包含有十条单变量曲线、三个共饱点和六个结晶区(KBr结晶区、NaBr结晶区、NaBr·2H2O结晶区、MgBr2·6H2O结晶区、CaBr2·6H2O结晶区、KBr·MgBr2·6H2O结晶区)。其中KBr结晶区最大,CaBr2·6H2O结晶区最小,表明在该体系中CaBr2·6H2O的溶解度最大,KBr溶解度最小。
中图分类号:
彭昌炜, 桑世华, 崔瑞芝, 任红保. 五元体系NaBr-KBr-MgBr2-CaBr2-H2O在298.15 K下的空间立体相图研究[J]. 化工学报, 2022, 73(11): 4850-4858.
Changwei PENG, Shihua SANG, Ruizhi CUI, Hongbao REN. Studies on three-dimensional phase diagram of the quinary system NaBr-KBr-MgBr2-CaBr2-H2O at 298.15 K[J]. CIESC Journal, 2022, 73(11): 4850-4858.
| No. | Systems | Composition of liquid phase w(B)/% | Jänecke index of dry slat J/(g/100 g) | Equilibria solids | Ref. | |||||
|---|---|---|---|---|---|---|---|---|---|---|
| NaBr | KBr | MgBr2 | CaBr2 | CaBr2 | MgBr2 | KBr | ||||
| 1 | MCB | 0.00 | 0.00 | 4.96 | 55.71 | 91.82 | 8.18 | 0.00 | MB6 + CB6 | [ |
| 2 | 0.00 | 0.00 | 5.92 | 54.37 | — | — | — | [ | ||
| 3 | KCB | 0.00 | 1.33 | 0.00 | 58.24 | 97.77 | 0.00 | 2.23 | KB + CB6 | [ |
| 4 | 0.00 | 0.81 | 0.00 | 59.14 | — | — | — | [ | ||
| 5 | KMB | 0.00 | 0.25 | 50.18 | 0.00 | 0.00 | 99.50 | 0.50 | MB6 + KMB6 | [ |
| 6 | 0.00 | 3.30 | 42.85 | 0.00 | 0.00 | 92.85 | 7.15 | KMB6 + KB | ||
| 7 | NKB | 43.94 | 7.42 | 0.00 | 0.00 | 0.00 | 0.00 | 14.45 | KB+ NB2 | [ |
| 8 | 43.06 | 7.23 | 0.00 | 0.00 | — | — | — | [ | ||
| 9 | NCB | 0.84 | 0.00 | 0.00 | 58.97 | 98.60 | 0.00 | 0.00 | CB6+ NB | [ |
| 10 | 10.32 | 0.00 | 0.00 | 42.28 | 80.38 | 0.00 | 0.00 | NB + NB2 | ||
| 11 | 0.76 | 0.00 | 0.00 | 59.34 | — | — | — | CB6+ NB | [ | |
| 12 | 8.61 | 0.00 | 0.00 | 44.6 | — | — | — | NB + NB2 | ||
| 13 | NMB | 3.50 | 0.00 | 47.96 | 0.00 | 0.00 | 96.81 | 0.00 | MB6 + NB | [ |
| 14 | 7.20 | 0.00 | 42.74 | 0.00 | 0.00 | 93.44 | 0.00 | NB + NB2 | ||
| 15 | 3.52 | 0.00 | 47.95 | 0.00 | — | — | — | MB6 + NB | [ | |
| 16 | 7.16 | 0.00 | 42.76 | 0.00 | — | — | — | NB + NB2 | ||
| F1 | KMCB | 0.00 | 0.14 | 4.73 | 55.21 | 91.89 | 7.87 | 0.23 | MB6 + KMB6 + CB6 | [ |
| F2 | 0.00 | 0.61 | 4.66 | 56.05 | 91.41 | 7.60 | 0.99 | KB + KMB6 + CB6 | ||
| F3 | NKCB | 0.74 | 1.50 | 0.00 | 57.76 | 96.27 | 0.00 | 2.50 | CB6 + NB + KB | [ |
| F4 | 10.45 | 3.05 | 0.00 | 40.61 | 75.05 | 0.00 | 5.64 | NB + NB2 + KB | ||
| F5 | NKMB | 3.42 | 0.22 | 47.21 | 0.00 | 0.00 | 92.84 | 0.43 | MB6 + NB+ KMB6 | [ |
| F6 | 7.06 | 0.43 | 42.36 | 0.00 | 0.00 | 84.97 | 0.86 | NB + KMB6 + NB2 | ||
| F7 | 8.06 | 3.81 | 36.13 | 0.00 | 0.00 | 75.27 | 7.94 | KMB6 + KB + NB2 | ||
| F8 | NMCB | 0.59 | 0.00 | 5.89 | 54.16 | 89.31 | 9.71 | 0.00 | MB6 + CB6 + NB | [ |
| E1 | NKMCB | 0.73 | 1.48 | 4.62 | 55.21 | 88.99 | 7.45 | 2.39 | NB + CB6 + KMB6 + KB | this work |
| E2 | 6.66 | 3.31 | 28.10 | 6.97 | 15.48 | 62.39 | 7.35 | NB2 + NB + KMB6 + KB | ||
| E3 | 0.54 | 0.21 | 4.84 | 55.15 | 90.80 | 7.96 | 0.35 | MB6 + KMB6 + NB + CB6 | ||
表1 298.15 K条件下五元体系NaBr-KBr-MgBr2-CaBr2-H2O及其四元、三元子体系共饱点的平衡液相及固相组成
Table 1 Equilibrium liquid and solid phase composition in the quinary system NaBr-KBr-MgBr2-CaBr2-H2Oand its quaternary and ternary subsystems at 298.15 K
| No. | Systems | Composition of liquid phase w(B)/% | Jänecke index of dry slat J/(g/100 g) | Equilibria solids | Ref. | |||||
|---|---|---|---|---|---|---|---|---|---|---|
| NaBr | KBr | MgBr2 | CaBr2 | CaBr2 | MgBr2 | KBr | ||||
| 1 | MCB | 0.00 | 0.00 | 4.96 | 55.71 | 91.82 | 8.18 | 0.00 | MB6 + CB6 | [ |
| 2 | 0.00 | 0.00 | 5.92 | 54.37 | — | — | — | [ | ||
| 3 | KCB | 0.00 | 1.33 | 0.00 | 58.24 | 97.77 | 0.00 | 2.23 | KB + CB6 | [ |
| 4 | 0.00 | 0.81 | 0.00 | 59.14 | — | — | — | [ | ||
| 5 | KMB | 0.00 | 0.25 | 50.18 | 0.00 | 0.00 | 99.50 | 0.50 | MB6 + KMB6 | [ |
| 6 | 0.00 | 3.30 | 42.85 | 0.00 | 0.00 | 92.85 | 7.15 | KMB6 + KB | ||
| 7 | NKB | 43.94 | 7.42 | 0.00 | 0.00 | 0.00 | 0.00 | 14.45 | KB+ NB2 | [ |
| 8 | 43.06 | 7.23 | 0.00 | 0.00 | — | — | — | [ | ||
| 9 | NCB | 0.84 | 0.00 | 0.00 | 58.97 | 98.60 | 0.00 | 0.00 | CB6+ NB | [ |
| 10 | 10.32 | 0.00 | 0.00 | 42.28 | 80.38 | 0.00 | 0.00 | NB + NB2 | ||
| 11 | 0.76 | 0.00 | 0.00 | 59.34 | — | — | — | CB6+ NB | [ | |
| 12 | 8.61 | 0.00 | 0.00 | 44.6 | — | — | — | NB + NB2 | ||
| 13 | NMB | 3.50 | 0.00 | 47.96 | 0.00 | 0.00 | 96.81 | 0.00 | MB6 + NB | [ |
| 14 | 7.20 | 0.00 | 42.74 | 0.00 | 0.00 | 93.44 | 0.00 | NB + NB2 | ||
| 15 | 3.52 | 0.00 | 47.95 | 0.00 | — | — | — | MB6 + NB | [ | |
| 16 | 7.16 | 0.00 | 42.76 | 0.00 | — | — | — | NB + NB2 | ||
| F1 | KMCB | 0.00 | 0.14 | 4.73 | 55.21 | 91.89 | 7.87 | 0.23 | MB6 + KMB6 + CB6 | [ |
| F2 | 0.00 | 0.61 | 4.66 | 56.05 | 91.41 | 7.60 | 0.99 | KB + KMB6 + CB6 | ||
| F3 | NKCB | 0.74 | 1.50 | 0.00 | 57.76 | 96.27 | 0.00 | 2.50 | CB6 + NB + KB | [ |
| F4 | 10.45 | 3.05 | 0.00 | 40.61 | 75.05 | 0.00 | 5.64 | NB + NB2 + KB | ||
| F5 | NKMB | 3.42 | 0.22 | 47.21 | 0.00 | 0.00 | 92.84 | 0.43 | MB6 + NB+ KMB6 | [ |
| F6 | 7.06 | 0.43 | 42.36 | 0.00 | 0.00 | 84.97 | 0.86 | NB + KMB6 + NB2 | ||
| F7 | 8.06 | 3.81 | 36.13 | 0.00 | 0.00 | 75.27 | 7.94 | KMB6 + KB + NB2 | ||
| F8 | NMCB | 0.59 | 0.00 | 5.89 | 54.16 | 89.31 | 9.71 | 0.00 | MB6 + CB6 + NB | [ |
| E1 | NKMCB | 0.73 | 1.48 | 4.62 | 55.21 | 88.99 | 7.45 | 2.39 | NB + CB6 + KMB6 + KB | this work |
| E2 | 6.66 | 3.31 | 28.10 | 6.97 | 15.48 | 62.39 | 7.35 | NB2 + NB + KMB6 + KB | ||
| E3 | 0.54 | 0.21 | 4.84 | 55.15 | 90.80 | 7.96 | 0.35 | MB6 + KMB6 + NB + CB6 | ||
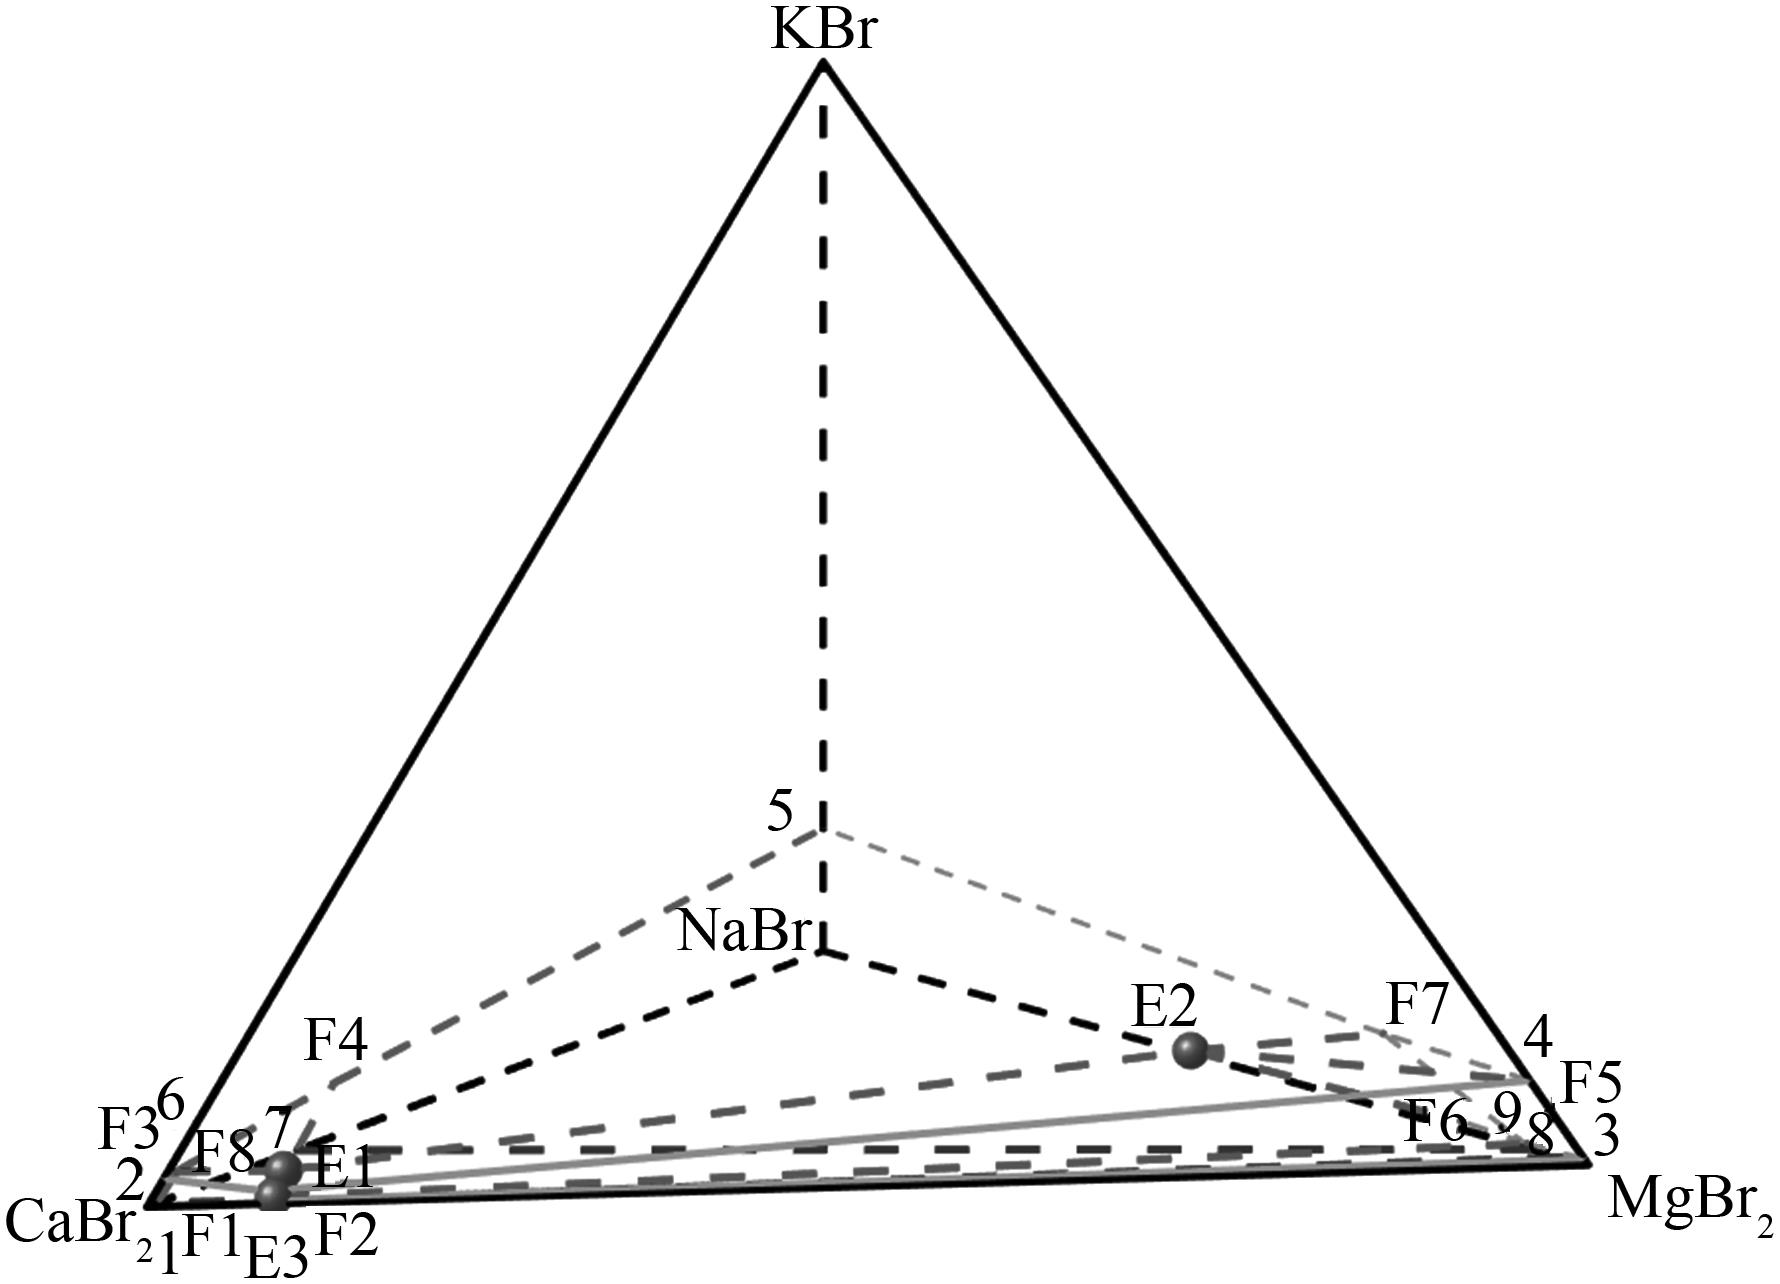
图1 298.15 K条件下五元体系NaBr-KBr-MgBr2-CaBr2-H2O空间立体相图
Fig.1 Three-dimensional phase diagram of quinary system NaBr-KBr-MgBr2-CaBr2-H2O at 298.15 K

图2 各结晶区空间立体图
Fig.2 Spatial stereogram of each crystallization zone

图3 各饱和面投影相图
Fig.3 Projected phase diagram of each saturation surface

图4 各饱和投影面水含量图
Fig.4 Water content diagram of each saturated projection surface
| No. | Composition of liquid phase w(B)/% | Jänecke index of dry slat J/(g/100 g) | Equilibrium solids | ||||||
|---|---|---|---|---|---|---|---|---|---|
| NaBr | KBr | MgBr2 | CaBr2 | NaBr | KBr | H2O | MgBr2 | ||
| 1, F1 | 0.00 | 0.14 | 4.73 | 55.21 | 0.00 | 0.25 | 72.12 | 8.55 | MB6 + KMB6 + CB6 |
| 2, E3 | 0.54 | 0.21 | 4.84 | 55.15 | 0.96 | 0.38 | 70.22 | 8.65 | MB6 + KMB6 + NB + CB6 |
| 3, F8 | 0.59 | 0.00 | 5.89 | 54.16 | 1.08 | 0.00 | 71.89 | 10.76 | CB6 + NB + MB6 |
| 4 | 0.54 | 0.12 | 5.27 | 54.20 | 0.99 | 0.22 | 72.65 | 9.61 | CB6 + NB + MB6 |
| 5, F5 | 3.42 | 0.22 | 47.21 | 0.00 | 93.96 | 6.04 | 1350.27 | 1296.98 | NB + KMB6 + MB6 |
| 6 | 1.84 | 0.23 | 47.02 | 2.04 | 44.79 | 5.53 | 1192.56 | 1147.34 | NB + KMB6 + MB6 |
| 7 | 1.91 | 0.24 | 45.01 | 5.88 | 23.82 | 3.02 | 584.66 | 560.37 | NB + KMB6 + MB6 |
| 8 | 1.54 | 0.23 | 41.54 | 9.26 | 13.93 | 2.06 | 430.28 | 376.83 | NB + KMB6 + MB6 |
| 9 | 1.46 | 0.23 | 38.24 | 15.83 | 8.32 | 1.33 | 252.45 | 218.26 | NB + KMB6 + MB6 |
| 10 | 1.14 | 0.22 | 30.78 | 24.02 | 4.48 | 0.88 | 172.70 | 121.27 | NB + KMB6 + MB6 |
| 11 | 1.16 | 0.21 | 26.24 | 28.73 | 3.84 | 0.70 | 145.06 | 87.20 | NB + KMB6 + MB6 |
| 12 | 0.76 | 0.21 | 18.28 | 38.96 | 1.91 | 0.52 | 104.64 | 45.78 | NB + KMB6 + MB6 |
| 13 | 0.69 | 0.21 | 10.63 | 50.21 | 1.34 | 0.41 | 74.90 | 20.80 | NB + KMB6 + MB6 |
| 14 | 0.63 | 0.22 | 6.56 | 53.59 | 1.16 | 0.40 | 71.65 | 12.05 | NB + KMB6 + MB6 |
表 2 298.15 K和0.0774 MPa条件下五元体系NaBr-KBr-MgBr2-CaBr2-H2O平衡液相及固相组成(MgBr2·6H2O饱和)
Table 2 Equilibrium liquid and solid phase composition in the quinary system NaBr-KBr-MgBr2-CaBr2-H2Oat 298.15 K and 0.0774 MPa (saturated with MgBr2·6H2O)
| No. | Composition of liquid phase w(B)/% | Jänecke index of dry slat J/(g/100 g) | Equilibrium solids | ||||||
|---|---|---|---|---|---|---|---|---|---|
| NaBr | KBr | MgBr2 | CaBr2 | NaBr | KBr | H2O | MgBr2 | ||
| 1, F1 | 0.00 | 0.14 | 4.73 | 55.21 | 0.00 | 0.25 | 72.12 | 8.55 | MB6 + KMB6 + CB6 |
| 2, E3 | 0.54 | 0.21 | 4.84 | 55.15 | 0.96 | 0.38 | 70.22 | 8.65 | MB6 + KMB6 + NB + CB6 |
| 3, F8 | 0.59 | 0.00 | 5.89 | 54.16 | 1.08 | 0.00 | 71.89 | 10.76 | CB6 + NB + MB6 |
| 4 | 0.54 | 0.12 | 5.27 | 54.20 | 0.99 | 0.22 | 72.65 | 9.61 | CB6 + NB + MB6 |
| 5, F5 | 3.42 | 0.22 | 47.21 | 0.00 | 93.96 | 6.04 | 1350.27 | 1296.98 | NB + KMB6 + MB6 |
| 6 | 1.84 | 0.23 | 47.02 | 2.04 | 44.79 | 5.53 | 1192.56 | 1147.34 | NB + KMB6 + MB6 |
| 7 | 1.91 | 0.24 | 45.01 | 5.88 | 23.82 | 3.02 | 584.66 | 560.37 | NB + KMB6 + MB6 |
| 8 | 1.54 | 0.23 | 41.54 | 9.26 | 13.93 | 2.06 | 430.28 | 376.83 | NB + KMB6 + MB6 |
| 9 | 1.46 | 0.23 | 38.24 | 15.83 | 8.32 | 1.33 | 252.45 | 218.26 | NB + KMB6 + MB6 |
| 10 | 1.14 | 0.22 | 30.78 | 24.02 | 4.48 | 0.88 | 172.70 | 121.27 | NB + KMB6 + MB6 |
| 11 | 1.16 | 0.21 | 26.24 | 28.73 | 3.84 | 0.70 | 145.06 | 87.20 | NB + KMB6 + MB6 |
| 12 | 0.76 | 0.21 | 18.28 | 38.96 | 1.91 | 0.52 | 104.64 | 45.78 | NB + KMB6 + MB6 |
| 13 | 0.69 | 0.21 | 10.63 | 50.21 | 1.34 | 0.41 | 74.90 | 20.80 | NB + KMB6 + MB6 |
| 14 | 0.63 | 0.22 | 6.56 | 53.59 | 1.16 | 0.40 | 71.65 | 12.05 | NB + KMB6 + MB6 |
| No. | Composition of liquid phase w(B)/% | Jänecke index of dry slat J/(g/100 g) | Equilibrium solids | ||||||
|---|---|---|---|---|---|---|---|---|---|
| NaBr | KBr | MgBr2 | CaBr2 | NaBr | KBr | H2O | CaBr2 | ||
| 1, F1 | 0.00 | 0.14 | 4.73 | 55.21 | 0.00 | 2.87 | 819.71 | 1133.68 | MB6 + KMB6 + CB6 |
| 2, E3 | 0.54 | 0.21 | 4.84 | 55.15 | 9.62 | 3.81 | 702.58 | 986.59 | MB6 + KMB6 + NB + CB6 |
| 3, F8 | 0.59 | 0.00 | 5.89 | 54.16 | 9.10 | 0.00 | 607.41 | 835.81 | MB6 + NB + CB6 |
| 4 | 0.54 | 0.12 | 5.27 | 54.20 | 9.16 | 2.00 | 671.35 | 914.00 | MB6 + NB + CB6 |
| 5, F2 | 0.00 | 0.61 | 4.66 | 56.05 | 0.00 | 11.57 | 733.97 | 1063.57 | KMB6 + KB + CB6 |
| 6 | 0.43 | 1.04 | 4.64 | 55.69 | 7.04 | 17.02 | 625.20 | 911.46 | KMB6 + KB + CB6 |
| 7, E1 | 0.73 | 1.48 | 4.62 | 55.21 | 10.69 | 21.67 | 555.78 | 808.35 | KMB6 + KB + NB + CB6 |
| 8, F3 | 0.74 | 1.50 | 0.00 | 57.76 | 33.04 | 66.96 | 1785.71 | 2578.57 | NB + KB + CB6 |
| 9 | 0.74 | 1.50 | 1.21 | 56.98 | 21.45 | 43.48 | 1146.96 | 1651.59 | NB + KB + CB6 |
| 10 | 0.74 | 1.50 | 2.56 | 56.01 | 15.42 | 31.25 | 816.46 | 1166.88 | NB + KB + CB6 |
| 11 | 0.74 | 1.49 | 3.66 | 55.89 | 12.56 | 25.30 | 648.90 | 648.90 | NB + KB + CB6 |
表 3 298.15 K和0.0774 MPa条件下五元体系NaBr-KBr-MgBr2-CaBr2-H2O平衡液相及固相组成(CaBr2·6H2O饱和)
Table 3 Equilibrium liquid and solid phase composition in the quinary system NaBr-KBr-MgBr2-CaBr2-H2Oat 298.15 K and 0.0774 MPa (saturated with CaBr2·6H2O)
| No. | Composition of liquid phase w(B)/% | Jänecke index of dry slat J/(g/100 g) | Equilibrium solids | ||||||
|---|---|---|---|---|---|---|---|---|---|
| NaBr | KBr | MgBr2 | CaBr2 | NaBr | KBr | H2O | CaBr2 | ||
| 1, F1 | 0.00 | 0.14 | 4.73 | 55.21 | 0.00 | 2.87 | 819.71 | 1133.68 | MB6 + KMB6 + CB6 |
| 2, E3 | 0.54 | 0.21 | 4.84 | 55.15 | 9.62 | 3.81 | 702.58 | 986.59 | MB6 + KMB6 + NB + CB6 |
| 3, F8 | 0.59 | 0.00 | 5.89 | 54.16 | 9.10 | 0.00 | 607.41 | 835.81 | MB6 + NB + CB6 |
| 4 | 0.54 | 0.12 | 5.27 | 54.20 | 9.16 | 2.00 | 671.35 | 914.00 | MB6 + NB + CB6 |
| 5, F2 | 0.00 | 0.61 | 4.66 | 56.05 | 0.00 | 11.57 | 733.97 | 1063.57 | KMB6 + KB + CB6 |
| 6 | 0.43 | 1.04 | 4.64 | 55.69 | 7.04 | 17.02 | 625.20 | 911.46 | KMB6 + KB + CB6 |
| 7, E1 | 0.73 | 1.48 | 4.62 | 55.21 | 10.69 | 21.67 | 555.78 | 808.35 | KMB6 + KB + NB + CB6 |
| 8, F3 | 0.74 | 1.50 | 0.00 | 57.76 | 33.04 | 66.96 | 1785.71 | 2578.57 | NB + KB + CB6 |
| 9 | 0.74 | 1.50 | 1.21 | 56.98 | 21.45 | 43.48 | 1146.96 | 1651.59 | NB + KB + CB6 |
| 10 | 0.74 | 1.50 | 2.56 | 56.01 | 15.42 | 31.25 | 816.46 | 1166.88 | NB + KB + CB6 |
| 11 | 0.74 | 1.49 | 3.66 | 55.89 | 12.56 | 25.30 | 648.90 | 648.90 | NB + KB + CB6 |
| No. | Composition of liquid phase w(B)/% | Jänecke index of dry slat J/(g/100 g) | Equilibrium solids | ||||||
|---|---|---|---|---|---|---|---|---|---|
| NaBr | KBr | MgBr2 | CaBr2 | MgBr2 | CaBr2 | H2O | NaBr | ||
| 1, F4 | 10.45 | 3.05 | 0.00 | 40.61 | 0.00 | 93.01 | 105.11 | 23.93 | KB + NB + NB2 |
| 2 | 10.02 | 3.07 | 1.99 | 37.31 | 4.70 | 88.06 | 112.37 | 23.65 | KB + NB + NB2 |
| 3 | 9.86 | 3.10 | 4.02 | 34.20 | 9.73 | 82.77 | 118.15 | 23.86 | KB + NB + NB2 |
| 4 | 9.30 | 3.13 | 6.72 | 29.90 | 16.91 | 75.22 | 128.18 | 23.40 | KB + NB + NB2 |
| 5 | 8.85 | 3.16 | 8.87 | 26.32 | 23.13 | 68.63 | 137.68 | 23.08 | KB + NB + NB2 |
| 6 | 8.46 | 3.18 | 12.7 | 21.79 | 33.71 | 57.84 | 143.01 | 22.46 | KB + NB + NB2 |
| 7 | 7.99 | 3.21 | 15.77 | 18.97 | 41.55 | 49.99 | 142.45 | 21.05 | KB + NB + NB2 |
| 8 | 7.47 | 3.25 | 19.76 | 14.86 | 52.18 | 39.24 | 144.34 | 19.73 | KB + NB + NB2 |
| 9 | 7.01 | 3.29 | 24.33 | 10.60 | 63.66 | 27.73 | 143.30 | 18.34 | KB + NB + NB2 |
| 10, E2 | 6.66 | 3.31 | 28.10 | 6.97 | 73.22 | 18.16 | 143.20 | 17.35 | KB + NB + KMB6 + NB2 |
| 11, F7 | 8.06 | 3.81 | 36.13 | 0.00 | 90.46 | 0.00 | 130.20 | 20.18 | KB + KMB6 + NB2 |
| 12 | 7.40 | 3.64 | 32.35 | 2.90 | 83.18 | 7.46 | 138.11 | 19.03 | KB + KMB6 + NB2 |
| 13 | 6.98 | 3.50 | 30.30 | 4.83 | 78.44 | 12.50 | 140.80 | 18.07 | KB + KMB6 + NB2 |
| 14, F6 | 7.06 | 0.43 | 42.36 | 0.00 | 99.00 | 0.00 | 117.20 | 16.50 | NB + KMB6 + NB2 |
表 4 298.15 K和0.0774 MPa条件下五元体系NaBr-KBr-MgBr2-CaBr2-H2O平衡液相及固相组成(NaBr·2H2O饱和)
Table 4 Equilibrium liquid and solid phase composition in the quinary system NaBr-KBr-MgBr2-CaBr2-H2Oat 298.15 K and 0.0774 MPa (saturated with NaBr·2H2O)
| No. | Composition of liquid phase w(B)/% | Jänecke index of dry slat J/(g/100 g) | Equilibrium solids | ||||||
|---|---|---|---|---|---|---|---|---|---|
| NaBr | KBr | MgBr2 | CaBr2 | MgBr2 | CaBr2 | H2O | NaBr | ||
| 1, F4 | 10.45 | 3.05 | 0.00 | 40.61 | 0.00 | 93.01 | 105.11 | 23.93 | KB + NB + NB2 |
| 2 | 10.02 | 3.07 | 1.99 | 37.31 | 4.70 | 88.06 | 112.37 | 23.65 | KB + NB + NB2 |
| 3 | 9.86 | 3.10 | 4.02 | 34.20 | 9.73 | 82.77 | 118.15 | 23.86 | KB + NB + NB2 |
| 4 | 9.30 | 3.13 | 6.72 | 29.90 | 16.91 | 75.22 | 128.18 | 23.40 | KB + NB + NB2 |
| 5 | 8.85 | 3.16 | 8.87 | 26.32 | 23.13 | 68.63 | 137.68 | 23.08 | KB + NB + NB2 |
| 6 | 8.46 | 3.18 | 12.7 | 21.79 | 33.71 | 57.84 | 143.01 | 22.46 | KB + NB + NB2 |
| 7 | 7.99 | 3.21 | 15.77 | 18.97 | 41.55 | 49.99 | 142.45 | 21.05 | KB + NB + NB2 |
| 8 | 7.47 | 3.25 | 19.76 | 14.86 | 52.18 | 39.24 | 144.34 | 19.73 | KB + NB + NB2 |
| 9 | 7.01 | 3.29 | 24.33 | 10.60 | 63.66 | 27.73 | 143.30 | 18.34 | KB + NB + NB2 |
| 10, E2 | 6.66 | 3.31 | 28.10 | 6.97 | 73.22 | 18.16 | 143.20 | 17.35 | KB + NB + KMB6 + NB2 |
| 11, F7 | 8.06 | 3.81 | 36.13 | 0.00 | 90.46 | 0.00 | 130.20 | 20.18 | KB + KMB6 + NB2 |
| 12 | 7.40 | 3.64 | 32.35 | 2.90 | 83.18 | 7.46 | 138.11 | 19.03 | KB + KMB6 + NB2 |
| 13 | 6.98 | 3.50 | 30.30 | 4.83 | 78.44 | 12.50 | 140.80 | 18.07 | KB + KMB6 + NB2 |
| 14, F6 | 7.06 | 0.43 | 42.36 | 0.00 | 99.00 | 0.00 | 117.20 | 16.50 | NB + KMB6 + NB2 |
| 1 | 宋彭生, 李武, 孙柏, 等. 盐湖资源开发利用进展[J]. 无机化学学报, 2011, 27(5): 801-815. |
| Song P S, Li W, Sun B, et al. Recent development on comprehensive utilization of salt lake resources[J]. Chinese Journal of Inorganic Chemistry, 2011, 27(5): 801-815. | |
| 2 | 林耀庭. 我国卤水溴资源及其开发前景展望[J]. 盐湖研究, 2000, 8(2): 59-67. |
| Lin Y T. Bromine resource in brines and its exploitation prospect[J]. Journal of Salt Lake Research, 2000, 8(2): 59-67. | |
| 3 | 张学平, 崔瑞芝, 桑世华. NaBr-CaBr2-H2O和KBr-CaBr2-H2O三元体系 273.15 K相平衡实验及计算[J]. 化工学报, 2021, 72(9): 4479-4486. |
| Zhang X P, Cui R Z, Sang S H. Experiment and calculation of phase equilibrium in ternary systems NaBr-CaBr2-H2O and KBr-CaBr2-H2O at 273.15 K[J]. CIESC Journal, 2021, 72(9): 4479-4486. | |
| 4 | 林耀庭, 陈绍兰. 四川盆地地下卤水勘探开发前景展望[J]. 盐湖研究, 2008, 16(1): 1-7, 21. |
| Lin Y T, Chen S L. Exploration and development prospect of underground brine in Sichuan basin[J]. Journal of Salt Lake Research, 2008, 16(1): 1-7, 21. | |
| 5 | 林耀庭, 姚有成, 康正华, 等. 四川宣达盐盆富钾富矿卤水地球化学特征及资源意义研究[J]. 盐湖研究, 2004, 12(1): 8-18. |
| Lin Y T, Yao Y C, Kang Z H, et al. Study on the geochemical characteristics and resource significance of the highly mineralized potassium-rich brine in the Sichuan Xuanda salt basin[J]. Journal of Salt Lake Research, 2004, 12(1): 8-18. | |
| 6 | 陈向楠, 王海增. 溴素资源与产业发展分析[J]. 盐业与化工, 2013, 42(6): 4-7. |
| Chen X N, Wang H Z. Bromine resource and analysis of the industry development[J]. Journal of Salt and Chemical Industry, 2013, 42(6): 4-7. | |
| 7 | 张婷婷, 桑世华. 低温下水盐体系相平衡研究进展[J]. 浙江化工, 2017, 48(3): 24-26. |
| Zhang T T, Sang S H. Progress on phase equilibria of salt-water systems at low temperature[J]. Zhejiang Chemical Industry, 2017, 48(3): 24-26. | |
| 8 | 邬莉婷, 李晨, 陈鹏, 等. 三元体系NH4Cl-NaCl-H2O 298 K介稳相平衡研究[J]. 云南化工, 2020, 47(5): 39-42. |
| Wu L T, Li C, Chen P, et al. Metastable phase equilibrium in the ternary system NH4Cl-NaCl-H2O at 298 K[J]. Yunnan Chemical Technology, 2020, 47(5): 39-42. | |
| 9 | 曹旭, 邓天龙, 李栋婵, 等. 含锂水盐体系相平衡研究进展[J]. 盐业与化工, 2009, 38(2): 36-40. |
| Cao X, Deng T L, Li D C, et al. Progresses on the phase equilibria of lithium-containing salt-water system[J]. Journal of Salt and Chemical Industry, 2009, 38(2): 36-40. | |
| 10 | 张杰, 史学伟, 赵双良, 等. 水盐体系相平衡研究进展[J]. 化工学报, 2016, 67(2): 379-389. |
| Zhang J, Shi X W, Zhao S L, et al. Progress in study on phase equilibria of salt-water systems[J]. CIESC Journal, 2016, 67(2): 379-389. | |
| 11 | Balarew C, Christov C, Valyashko V, et al. Thermodynamics of formation of carnallite type double salts[J]. Journal of Solution Chemistry, 1993, 22: 173-181. |
| 12 | Donchev S, Ismailov I, Parushev I, et al. Solubility in the NH4Br-CaBr2-H2O system at T = (298.15 and 323.15) K[J]. Research Journal of Pharmaceutical, Biological and Chemical Sciences, 2019, 10(5): 83-88. |
| 13 | Kartzmark E M. Solubilities in the system indium tribromide-sodium bromide-water at 25℃[J]. Canadian Journal of Chemistry, 1976, 54(12): 1884-1885. |
| 14 | Meng L Z, Li D, Guo Y F, et al. Experimental study on solid and liquid equilibria of the system MgCl2-MgBr2-MgSO4-H2O at 323.15 K [J]. Journal of Chemical & Engineering Data, 2013, 58(12): 3499-3503. |
| 15 | Charykova M V, Charykov N A. Thermodynamic model of natural brines accounting for the presence of trace components (Ⅱ): System Na+, K+, Mg2+ ‖Cl-, Br--H2O[J]. Geochemistry International, 2007, 45(10): 1040-1049. |
| 16 | 桑世华, 殷辉安, 倪师军, 等. 三元体系K2B4O7-KBr-H2O在298 K的相平衡研究[J]. 成都理工大学学报(自然科学版), 2006, 33(4): 414-416. |
| Sang S H, Yin H A, Ni S J, et al. A study on equilibrium solubilities and properties of solutions in the ternary system K2B4O7-KBr-H2O at 298 K[J]. Journal of Chengdu University of Technology (Science & Technology Edition), 2006, 33(4): 414-416. | |
| 17 | Cui R Z, Li W, Dong Y P, et al. Measured and predicted solubility phase diagrams of quaternary systems LiBr-NaBr-MgBr2-H2O and LiBr-KBr-MgBr2-H2O at 298.15 K[J]. Chemical Research in Chinese Universities, 2020, 36(6): 1234-1240. |
| 18 | Cui R Z, Li W, Dong Y P, et al. Phase equilibrium and phase diagram for the quaternary system LiBr-NaBr-KBr-H2O at 298.15 K[J]. Journal of Chemical & Engineering Data, 2020, 65(6): 3021-3028. |
| 19 | Sang S H, Cui R Z, Hu J W, et al. Measurements of the solid-liquid equilibria in the quaternary system NaCl-NaBr-Na2SO4-H2O at 323 K[J]. Journal of Solution Chemistry, 2013, 42(8): 1633-1640. |
| 20 | Liu Q, Gao Y Y, Sang S H, et al. Solid-liquid equilibria in the quaternary systems NaBr-SrBr2-MgBr2-H2O and KBr-SrBr2-MgBr2-H2O at 323 K[J]. Journal of Chemical & Engineering Data, 2017, 62(4): 1264-1268. |
| 21 | Sang S H, Zhang H, Zhong S Y, et al. Experimental study of the solubilities of salts in the systems Na2B4O7-NaBr-H2O and Na2B4O7-Na2SO4-NaBr-H2O at 323 K[J]. Fluid Phase Equilibria, 2014, 361: 171-174. |
| 22 | Hu Y X, Sang S H, Cui R Z, et al. Solid-liquid equilibria in the quaternary system KCl-KBr-K2B4O7-H2O at 323 K[J]. Journal of Chemical & Engineering Data, 2014, 59(6): 1886-1891. |
| 23 | Nie G L, Sang S H, Cui R Z. Measurements of the solid-liquid phase equilibria in quinary system NaBr-KBr-MgBr2-SrBr2-H2O at 323 K[J]. Journal of Chemical & Engineering Data, 2019, 64(8): 3436-3443. |
| 24 | Hu J X, Sang S H, Zhou M F, et al. Phase equilibria in the ternary systems KBr-MgBr2-H2O and NaBr-MgBr2-H2O at 348.15 K[J]. Fluid Phase Equilibria, 2015, 392: 127-131. |
| 25 | Zhang K J, Sang S H, Li T, et al. Liquid-solid equilibria in the quaternary system KCl-KBr-K2SO4-H2O at 348 K[J]. Journal of Chemical & Engineering Data, 2013, 58(1): 115-117. |
| 26 | Hu J X, Sang S H, Liu Q Z. Measurements and calculations of the solid-liquid equilibria in the quaternary systems NaBr-KBr-MgBr2-H2O and NaBr-KBr-CaBr2-H2O at 348.15 K[J]. Journal of Solution Chemistry, 2015, 44(10): 1963-1975. |
| 27 | 桑世华, 崔瑞芝, 胡咏霞. 三元体系NaBr-Na2SO4-H2O和NaBr-KBr-H2O 373 K相平衡[J]. 高校化学工程学报, 2014, 28(5): 939-943. |
| Sang S H, Cui R Z, Hu Y X. Phase equilibria of two ternary systems NaBr-Na2SO4-H2O and NaBr-KBr-H2O at 373 K[J]. Journal of Chemical Engineering of Chinese Universities, 2014, 28(5): 939-943. | |
| 28 | Cui R Z, Sang S H, Hu Y X. Solid-liquid equilibria in the quaternary systems KCl-KBr-K2B4O7-H2O and KCl-KBr-K2SO4-H2O at 373 K[J]. Journal of Chemical & Engineering Data, 2013, 58(2): 477-481. |
| 29 | 聂国亮, 桑世华, 崔瑞芝. 298 K和323 K条件下五元体系NaBr-KBr-MgBr2-CaBr2-H2O相平衡研究[J]. 化工学报, 2019, 70(9): 3267-3274. |
| Nie G L, Sang S H, Cui R Z. Phase equilibria in quinary system NaBr-KBr-MgBr2-CaBr2-H2O at 298 K and 323 K[J]. CIESC Journal, 2019, 70(9): 3267-3274. | |
| 30 | Cui R Z, Wang Z C, Xu J S, et al. Measurements and calculations of solid-liquid equilibria in the quaternary system KBr-CaBr2-MgBr2-H2O at (298 and 323) K[J]. Fluid Phase Equilibria, 2017, 450: 140-148. |
| 31 | Nie G L, Sang S H, Cui R Z. Solid-liquid equilibrium phase diagram and calculation in the quaternary system (KBr + NaBr + MgBr2 + H2O) at 298 K[J]. Journal of Solution Chemistry, 2019, 48(6): 862-874. |
| 32 | Cui R Z, Sang S H, Li W, et al. (Solid + liquid) phase equilibria in the quaternary system (NaBr + MgBr2 + CaBr2 + H2O) at 298.15 K[J]. Journal of Chemical & Engineering Data, 2018, 63(9): 3400-3407. |
| 33 | Cui R Z, Sang S H, Li D W, et al. Measurements and calculations of solid-liquid equilibria in the quaternary system NaBr-KBr-CaBr2-H2O at 298 K[J]. Calphad, 2015, 49: 120-126. |
| [1] | 盛冰纯, 于建国, 林森. 铝基锂吸附剂分离高钠型地下卤水锂资源过程研究[J]. 化工学报, 2023, 74(8): 3375-3385. |
| [2] | 于旭东, 李琪, 陈念粗, 杜理, 任思颖, 曾英. 三元体系KCl + CaCl2 + H2O 298.2、323.2及348.2 K相平衡研究及计算[J]. 化工学报, 2023, 74(8): 3256-3265. |
| [3] | 陈科, 杜理, 曾英, 任思颖, 于旭东. 四元体系LiCl+MgCl2+CaCl2+H2O 323.2 K相平衡研究及计算[J]. 化工学报, 2023, 74(5): 1896-1903. |
| [4] | 程文婷, 李杰, 徐丽, 程芳琴, 刘国际. AlCl3·6H2O在FeCl3、CaCl2、KCl及KCl–FeCl3溶液中溶解度的实验及预测[J]. 化工学报, 2023, 74(2): 642-652. |
| [5] | 高靖博, 孙强, 李青, 王逸伟, 郭绪强. 考虑水合物结构转变的含氢气体水合物相平衡模型[J]. 化工学报, 2023, 74(2): 666-673. |
| [6] | 蔡进, 王晓辉, 汤涵, 陈光进, 孙长宇. TBAB水溶液体系中半笼型水合物的相平衡预测模型[J]. 化工学报, 2023, 74(1): 408-415. |
| [7] | 周桓, 张梦丽, 郝晴, 吴思, 李杰, 徐存兵. 硫酸镁型光卤石转化钾盐镁矾的过程机制与动态规律[J]. 化工学报, 2022, 73(9): 3841-3850. |
| [8] | 刘潜, 张香兰, 李志平, 李玉龙, 韩梦醒. 油酚分离过程低共熔溶剂的筛选及萃取性能研究[J]. 化工学报, 2022, 73(9): 3915-3928. |
| [9] | 张家仁, 刘海超. 大豆油与甲醇酯交换反应体系的相平衡研究[J]. 化工学报, 2022, 73(5): 1920-1929. |
| [10] | 吴子睿, 孙瑞, 石凌峰, 田华, 王轩, 舒歌群. CO2混合工质的气液相平衡的混合规则对比与预测研究[J]. 化工学报, 2022, 73(4): 1483-1492. |
| [11] | 门文欣, 彭庆收, 桂霞. 不同季铵盐作用下的CO2水合物相平衡[J]. 化工学报, 2022, 73(4): 1472-1482. |
| [12] | 孙裕坤, 杨焘, 吴江涛. R32+R1234yf+R1234ze(E)混合制冷剂气液相平衡实验研究[J]. 化工学报, 2022, 73(3): 1063-1071. |
| [13] | 许昊, 陈伟, 李邹路. 以[Li(TX-7)]SCN/H2O为工质对的第二类热泵特性研究[J]. 化工学报, 2022, 73(2): 577-586. |
| [14] | 高腾飞, 李国选, 雷志刚. 从催化裂化柴油中分离联苯的溶剂筛选:实验和计算热力学[J]. 化工学报, 2022, 73(12): 5314-5323. |
| [15] | 刘潜, 张香兰, 李志平, 栗卓琦, 喻红. 油酚分离过程离子液体萃取溶剂的多尺度筛选[J]. 化工学报, 2022, 73(11): 5011-5024. |
| 阅读次数 | ||||||
|
全文 |
|
|||||
|
摘要 |
|
|||||
 京公网安备 11010102001995号