CIESC Journal ›› 2022, Vol. 73 ›› Issue (4): 1754-1762.DOI: 10.11949/0438-1157.20211593
• Material science and engineering, nanotechnology • Previous Articles Next Articles
Min SUN1,2,3( ),Hui JIA1,2,3(),Qingwen QIN1,3,4,Qi WANG5,Zinan GUO5,Yanru LUO1,2,3,Jie WANG1,2,3
Received:2021-11-09
Revised:2022-02-09
Online:2022-04-25
Published:2022-04-05
Contact:
Hui JIA
孙敏1,2,3(),贾辉1,2,3(),秦卿雯1,3,4,王琦5,郭子楠5,罗艳茹1,2,3,王捷1,2,3
通讯作者:
贾辉
作者简介:孙敏(1996—),女,硕士研究生,基金资助:CLC Number:
Min SUN, Hui JIA, Qingwen QIN, Qi WANG, Zinan GUO, Yanru LUO, Jie WANG. In-situ online monitoring of ultrafiltration membrane fouling based on electrical impedance tomography[J]. CIESC Journal, 2022, 73(4): 1754-1762.
孙敏, 贾辉, 秦卿雯, 王琦, 郭子楠, 罗艳茹, 王捷. 电阻抗成像原位在线监测超滤膜污染行为研究[J]. 化工学报, 2022, 73(4): 1754-1762.
Add to citation manager EndNote|Ris|BibTeX

Fig.1 Schematic diagram of experimental device(a) Schematic diagram of experimental device; (b) Exploded diagram of EIT evaluation pool; (c) The experimental device1—computer; 2—permeate tank; 3—electronic balance; 4—image processing system; 5—peristaltic pump; 6—pressure sensor; 7—paperless recorder; 8—evaluation pool; 9—data acquisition and processing unit; 10—peristaltic pump; 11—feed solution tank
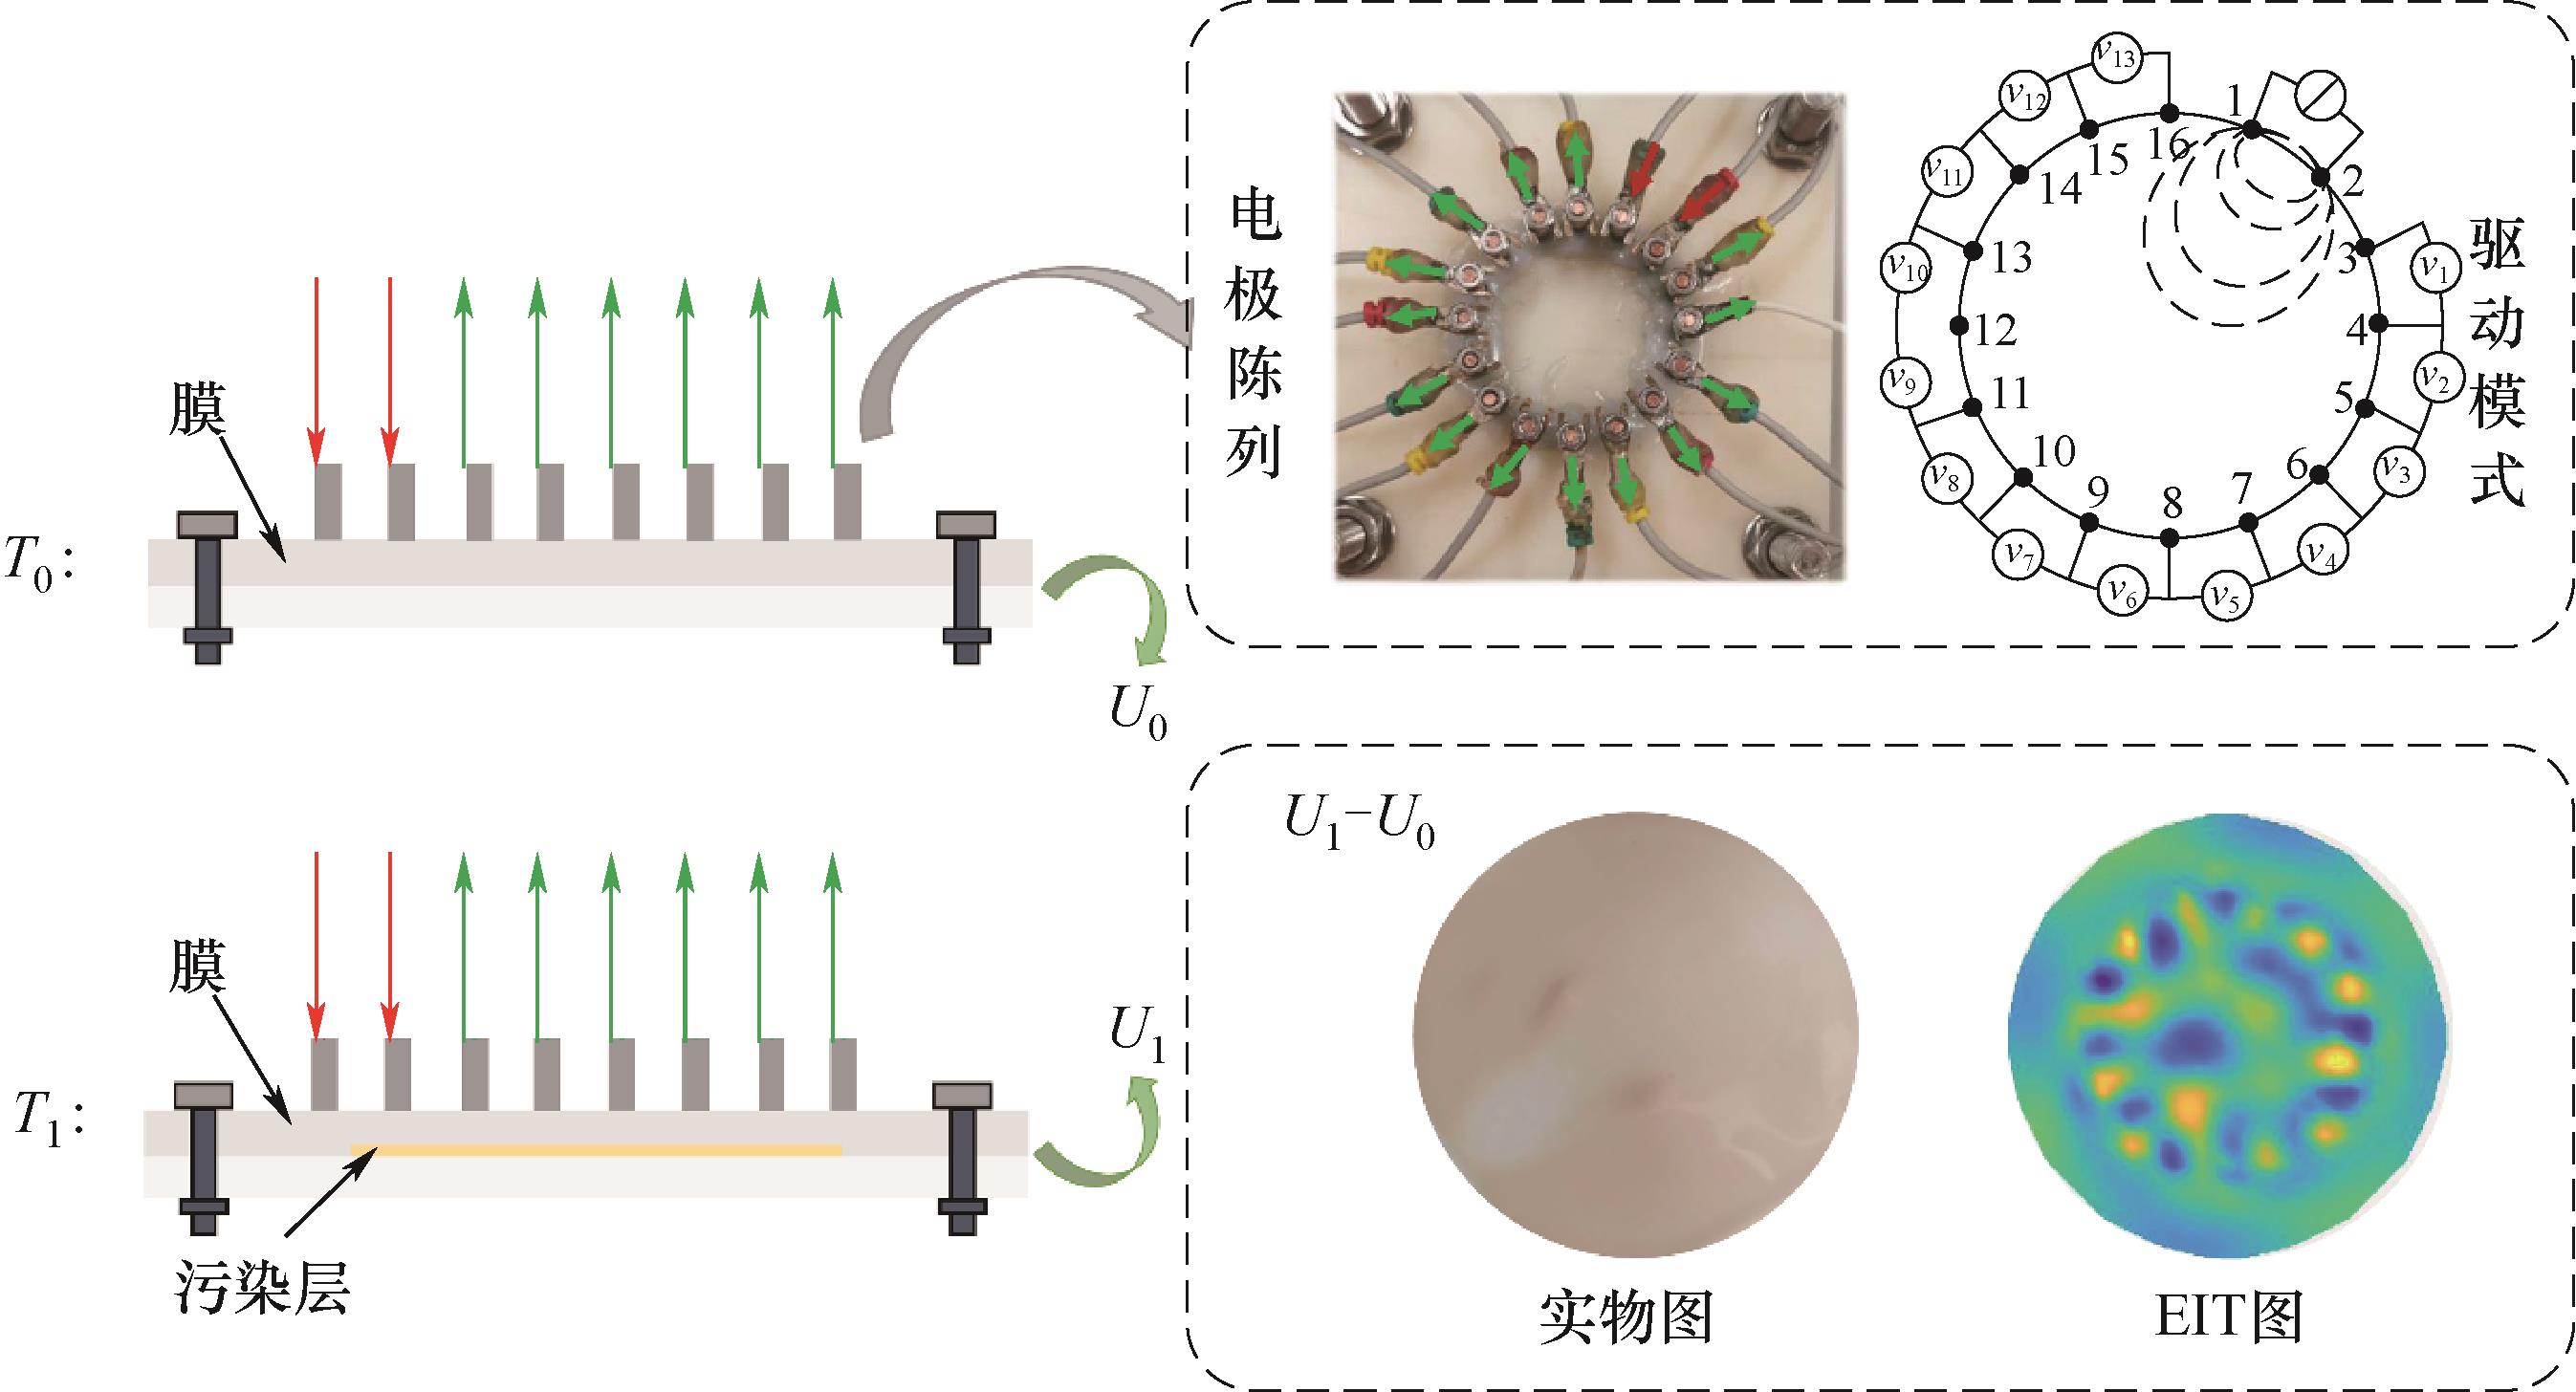
Fig.2 Schematic diagram of the principle of EIT to monitor membrane fouling

Fig.3 Correlation between flux and average voltage
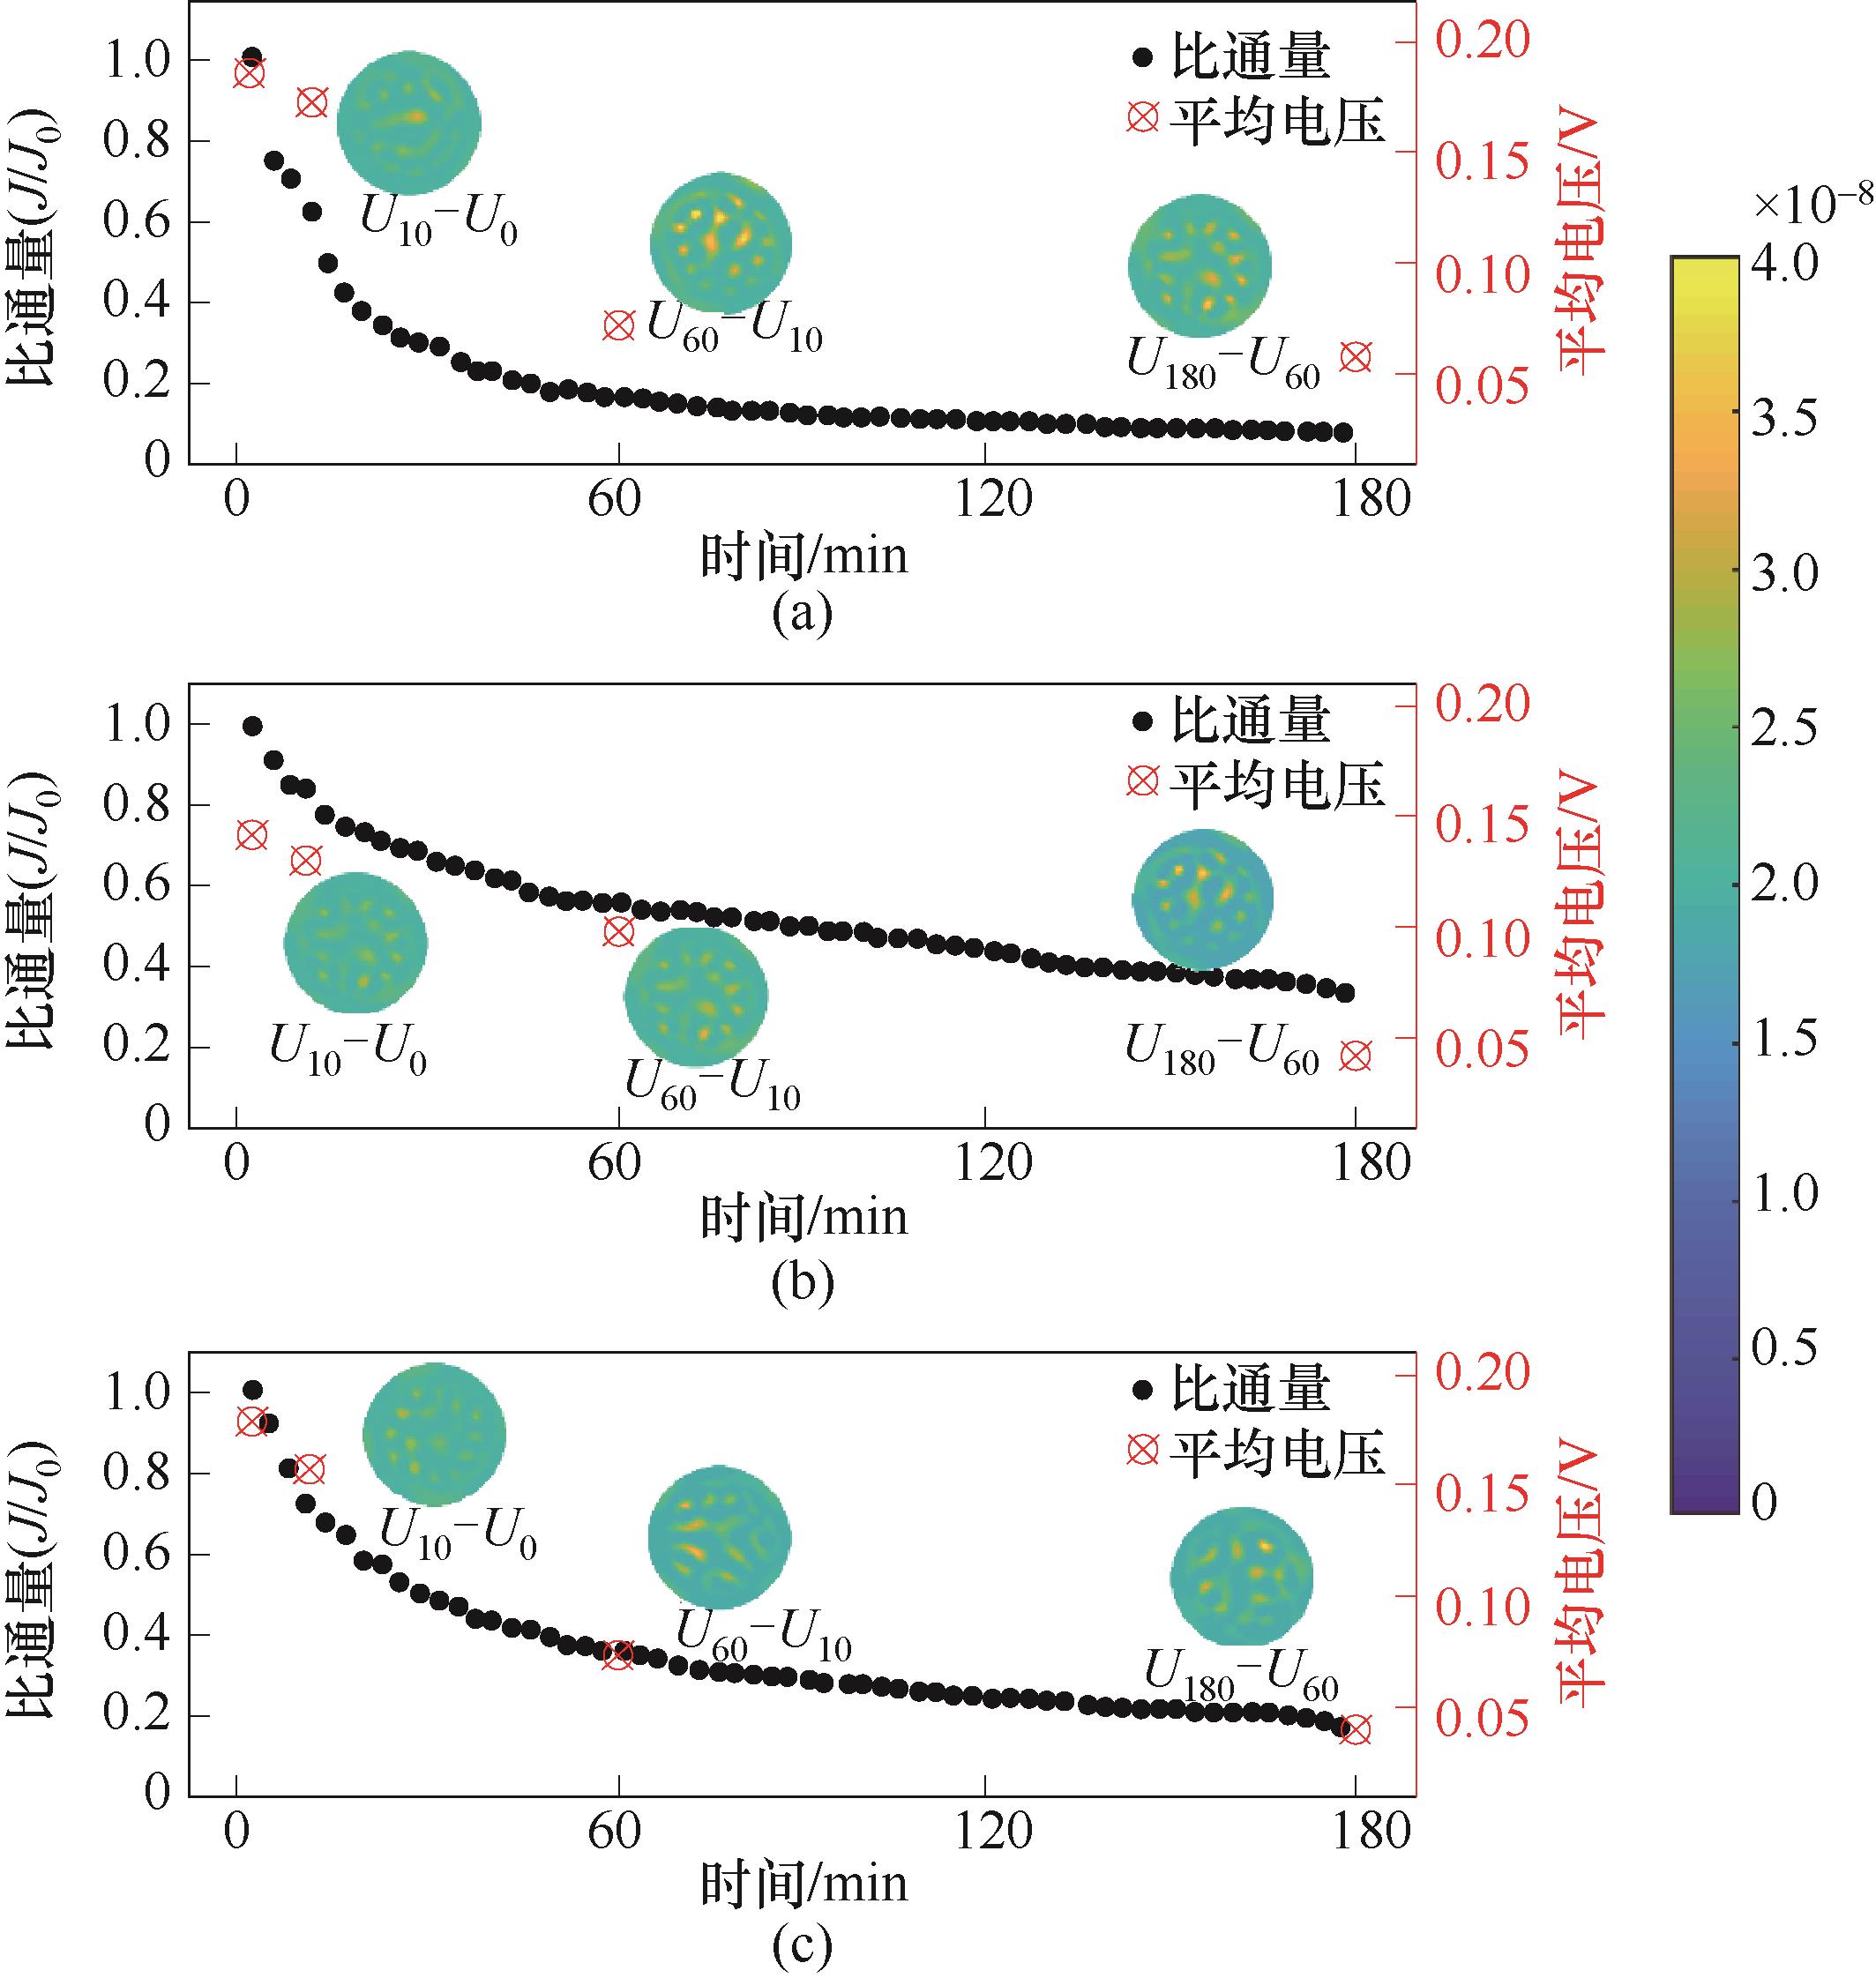
Fig.4 Specific flux, average voltage, EIT image chart changes of yeast solution (a), kaolin solution (b), yeast and kaolin mixture solution (c) with filtration time within 180 min
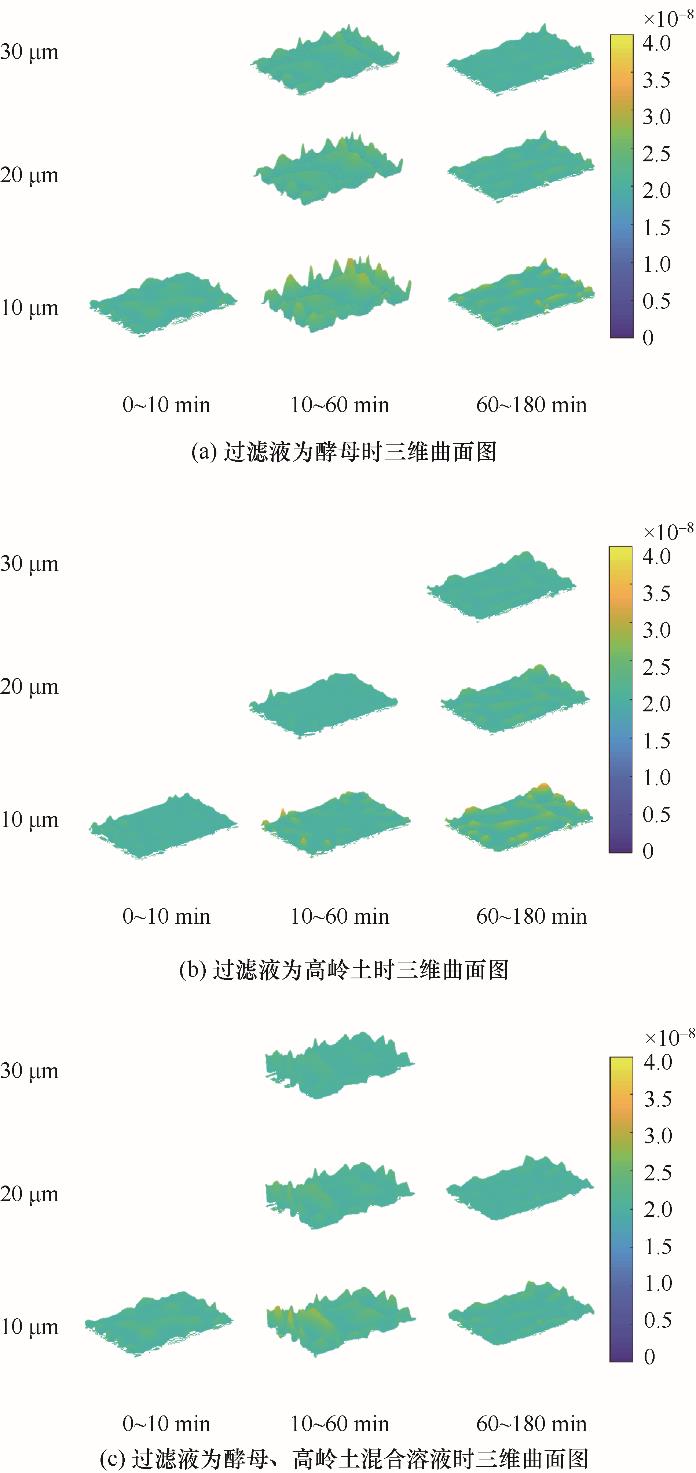
Fig.5 Three-dimensional surface diagrams of yeast solution, kaolin solution, yeast and kaolin mixture solution in different imaging sections within 180 min
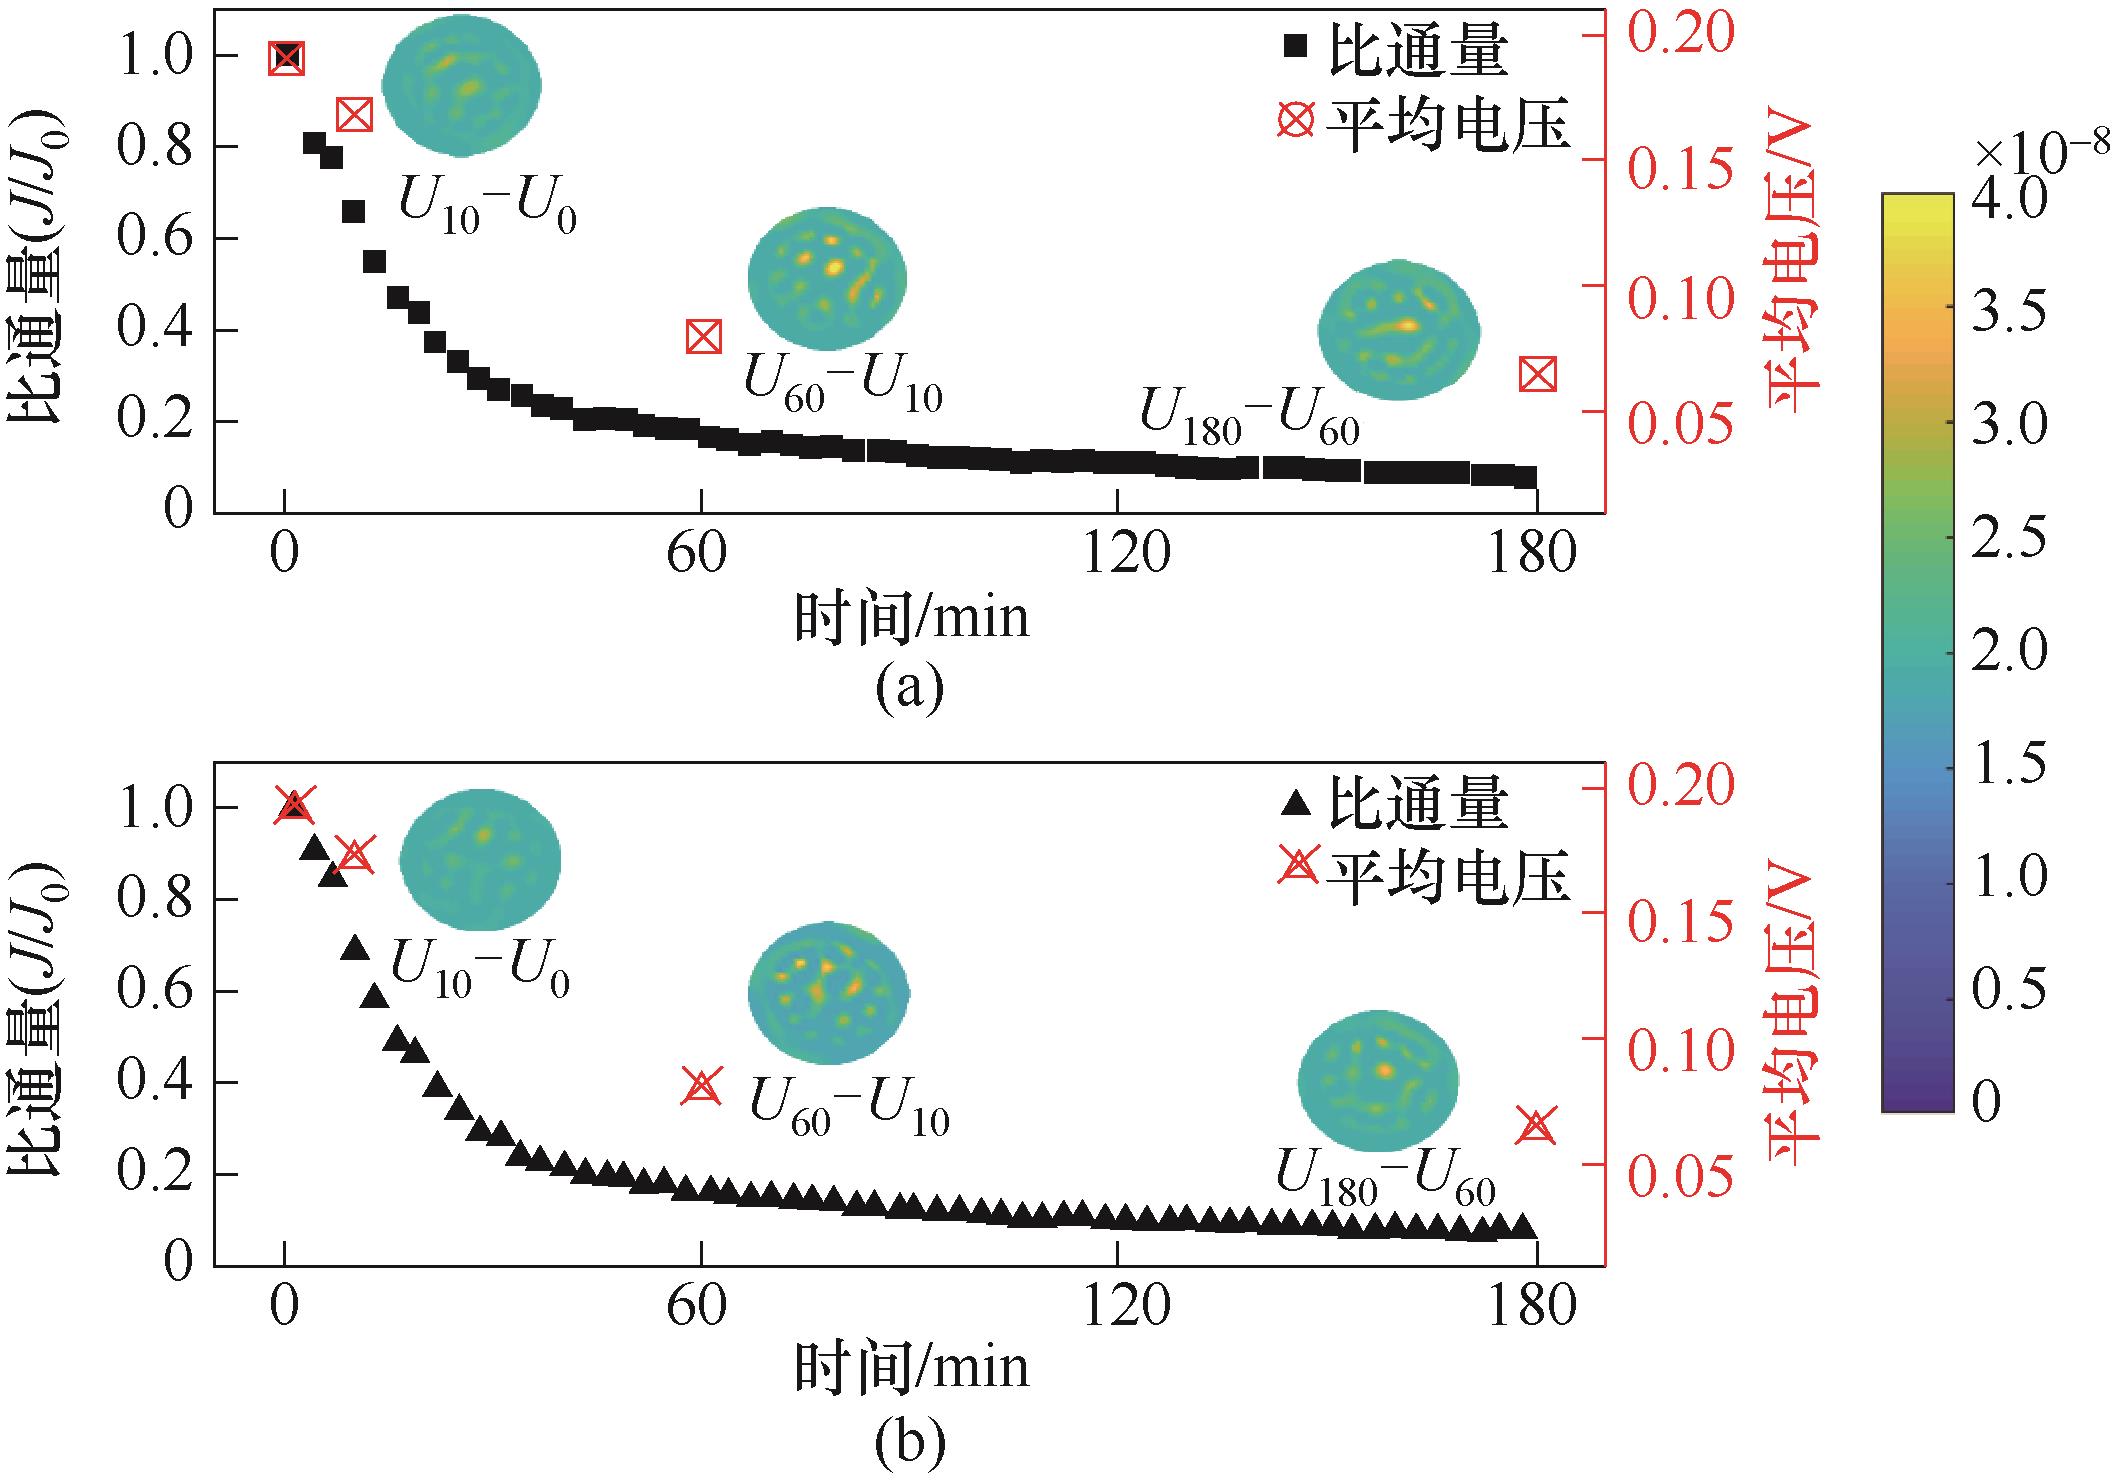
Fig.6 The flux change, average voltage change and EIT image of the yeast solution at a cross-flow velocity of 0.1 m/s (a) and 0.2 m/s (b) within 180 min
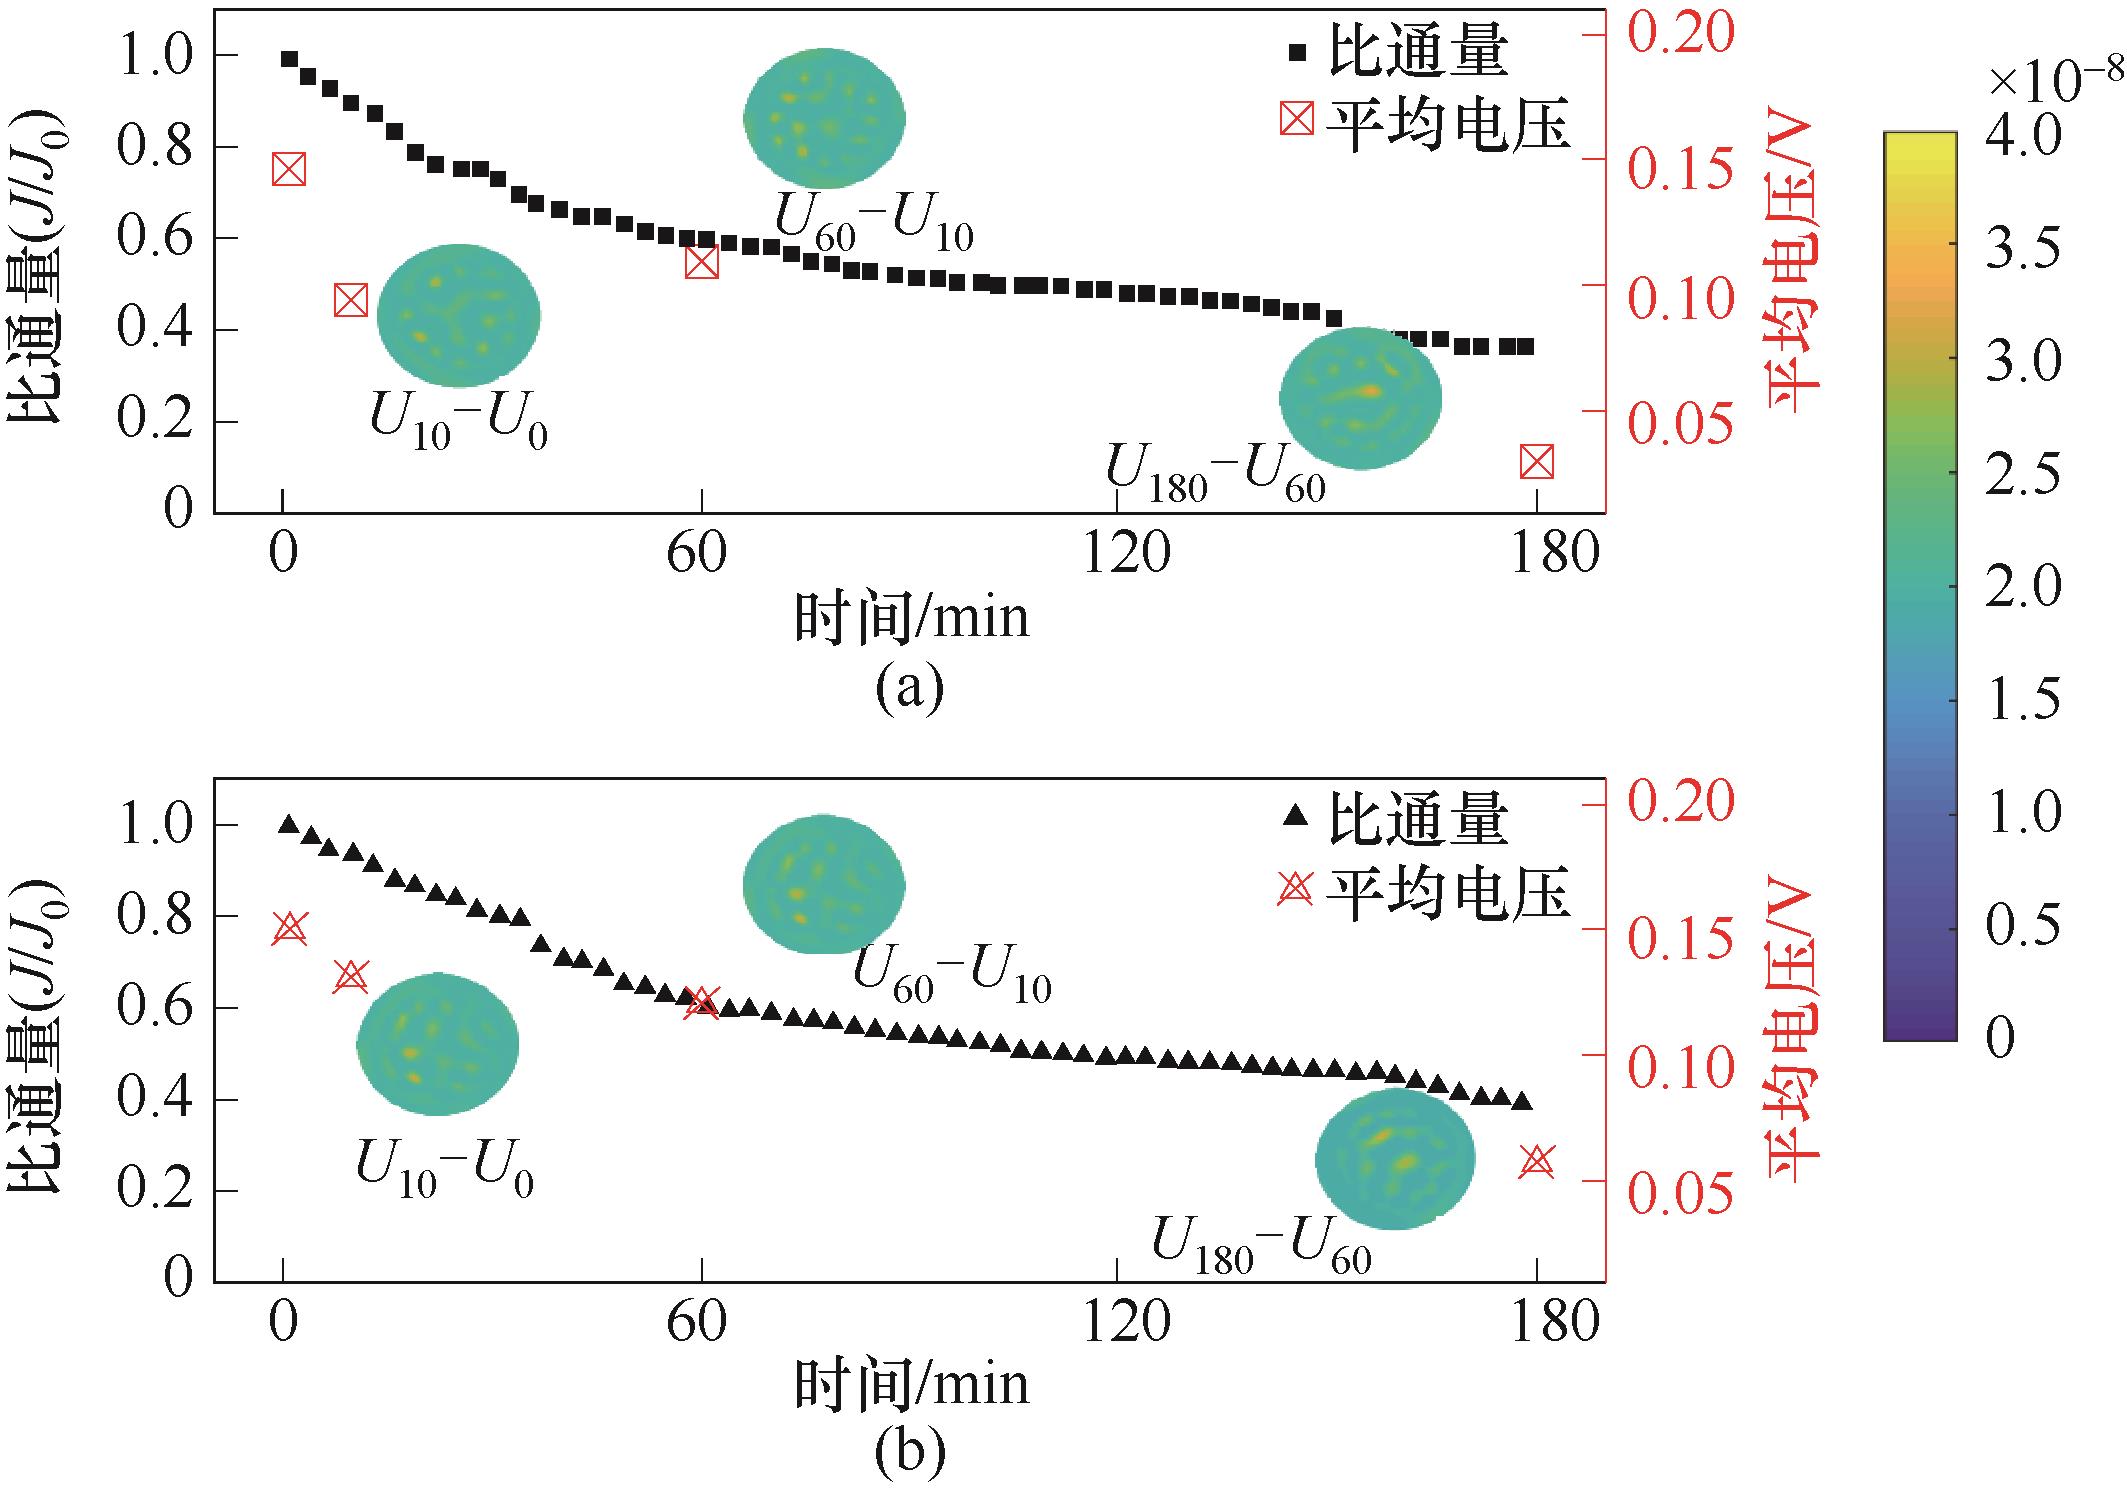
Fig.7 The flux change, average voltage change and EIT image of the kaolin solution at a cross-flow velocity of 0.1 m/s (a) and 0.2 m/s (b) within 180 min
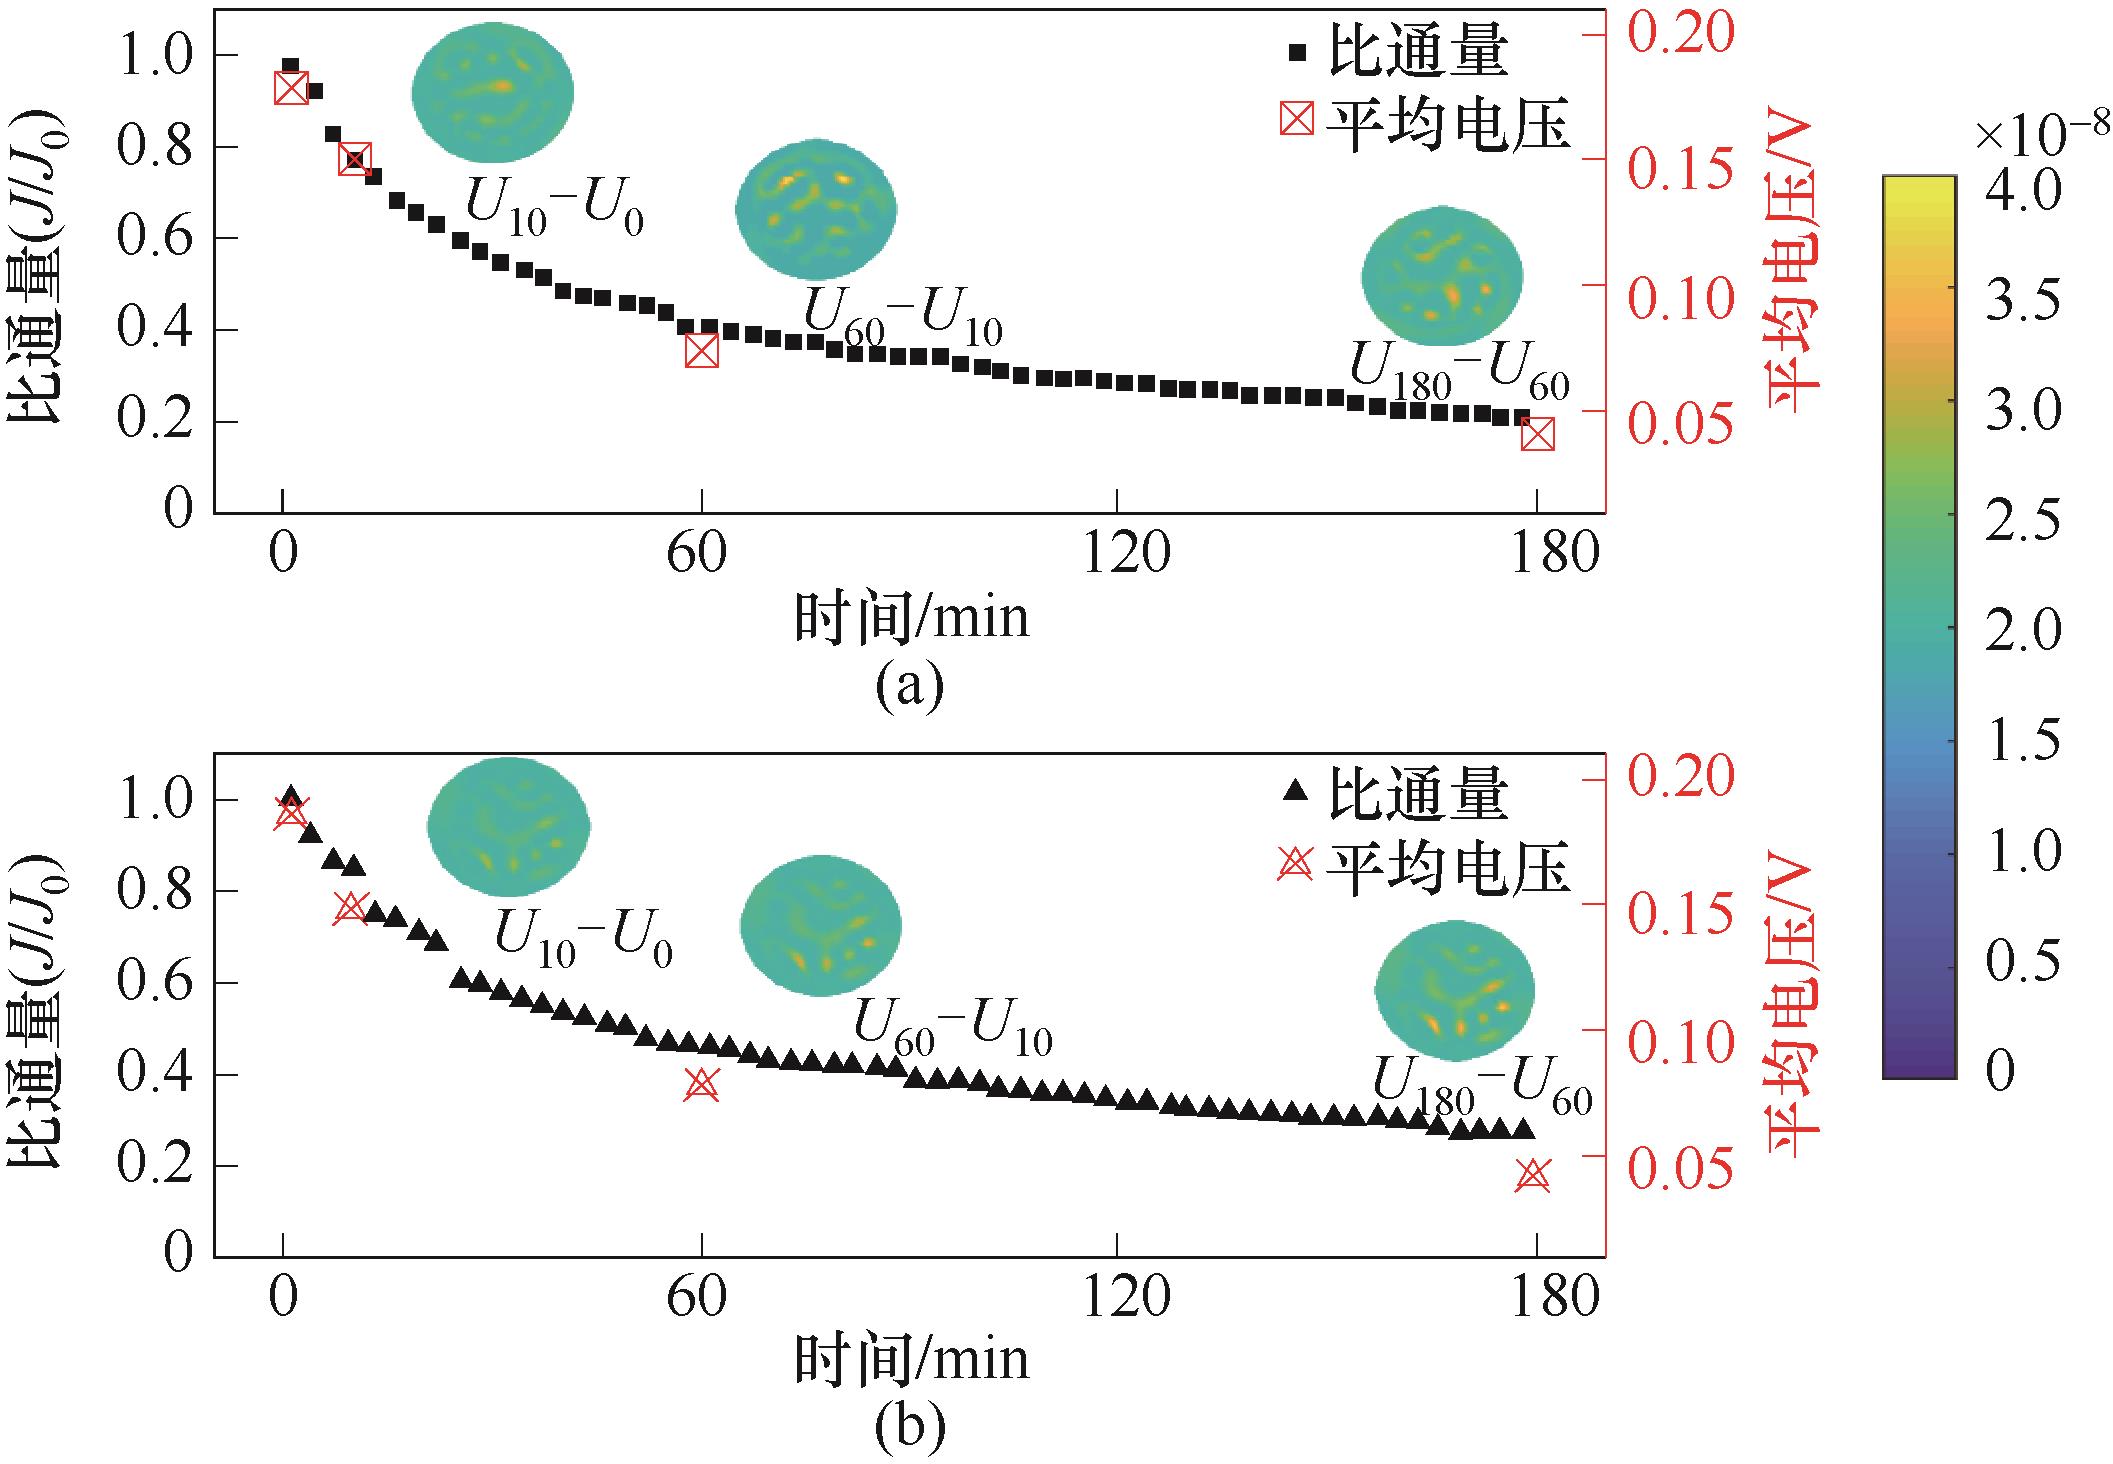
Fig.8 The flux change, average voltage change and EIT image of the yeast and kaolin mixed solution at a cross-flow velocity of 0.1 m/s (a) and 0.2 m/s (b) within 180 min
| 1 | 邢卫红, 仲兆祥, 景文珩, 等. 基于膜表面与界面作用的膜污染控制方法[J]. 化工学报, 2013, 64(1): 173-181. |
| Xing W H, Zhong Z X, Jing W H, et al. Controlling of membrane fouling based on membrane interface interactions[J]. CIESC Journal, 2013, 64(1): 173-181. | |
| 2 | Peiris R H, Budman H, Moresoli C, et al. Development of a species specific fouling index using principal component analysis of fluorescence excitation-emission matrices for the ultrafiltration of natural water and drinking water production[J]. Journal of Membrane Science, 2011, 378(1/2): 257-264. |
| 3 | 王旭亮, 李宗雨, 董泽亮, 等. 超滤技术在水处理中的膜污染及控制[J]. 当代化工, 2019, 48(9): 2151-2153, 2157. |
| Wang X L, Li Z Y, Dong Z L, et al. Membrane fouling and control of ultrafiltration technology in water treatment[J]. Contemporary Chemical Industry, 2019, 48(9): 2151-2153, 2157. | |
| 4 | Goh P S, Lau W J, Othman M H D, et al. Membrane fouling in desalination and its mitigation strategies[J]. Desalination, 2018, 425: 130-155. |
| 5 | Park D J, Supekar O D, Greenberg A R, et al. Real-time monitoring of calcium sulfate scale removal from RO desalination membranes using Raman spectroscopy[J]. Desalination, 2021, 497: 114736. |
| 6 | Yu W M, Liu Y, Xu Y C, et al. A conductive PVDF-Ni membrane with superior rejection, permeance and antifouling ability via electric assisted in situ aeration for dye separation[J]. Journal of Membrane Science, 2019, 581: 401-412. |
| 7 | Vrijenhoek E M, Hong S, Elimelech M. Influence of membrane surface properties on initial rate of colloidal fouling of reverse osmosis and nanofiltration membranes[J]. Journal of Membrane Science, 2001, 188(1): 115-128. |
| 8 | Marroquin M, Vu A, Bruce T, et al. Location and quantification of biological foulants in a wet membrane structure by cross-sectional confocal laser scanning microscopy[J]. Journal of Membrane Science, 2014, 453: 282-291. |
| 9 | Chen J C, Li Q L, Elimelech M. In situ monitoring techniques for concentration polarization and fouling phenomena in membrane filtration[J]. Advances in Colloid and Interface Science, 2004, 107(2/3): 83-108. |
| 10 | Li H, Fane A G, Coster H G L, et al. Direct observation of particle deposition on the membrane surface during crossflow microfiltration[J]. Journal of Membrane Science, 1998, 149(1): 83-97. |
| 11 | Gao Y B, Haavisto S, Li W Y, et al. Novel approach to characterizing the growth of a fouling layer during membrane filtration via optical coherence tomography[J]. Environmental Science & Technology, 2014, 48(24): 14273-14281. |
| 12 | Hammer B E, Heath C A, Mirer S D, et al. Quantitative flow measurements in bioreactors by nuclear magnetic resonance imaging[J]. Bio/Technology, 1990, 8 (4): 327-330. |
| 13 | Azizighannad S, Intrchom W, Mitra S. Raman imaging of membrane fouling[J]. Separation and Purification Technology, 2020, 242: 116763. |
| 14 | 周勇. 基于电场特征空间映射的深度学习电阻抗成像方法研究[D]. 天津: 天津工业大学, 2019. |
| Zhou Y. Research on deep learning electrical impedance imaging method based on electric field feature space mapping[D]. Tianjin: Tianjin Polytechnic University, 2019. | |
| 15 | Cherepenin V A, Karpov A Y, Korjenevsky A V, et al. Three-dimensional EIT imaging of breast tissues: system design and clinical testing[J]. IEEE Transactions on Medical Imaging, 2002, 21(6): 662-667. |
| 16 | Kim M, Kim H, Jang J, et al. 21.2 A 1.4mΩ-sensitivity 94dB-dynamic-range electrical impedance tomography SoC and 48-channel Hub SoC for 3D lung ventilation monitoring system[C]//2017 IEEE International Solid-State Circuits Conference. IEEE, 2017: 354-355. |
| 17 | Xu C H, Dai M, You F S, et al. An optimized strategy for real-time hemorrhage monitoring with electrical impedance tomography[J]. Physiological Measurement, 2011, 32(5): 585-598. |
| 18 | 周小勇, 余佳干, 李田军, 等. 电阻抗成像技术在水泥基材料渗水检测中的应用[J]. 无损检测, 2017, 39(4): 26-30. |
| Zhou X Y, Yu J G, Li T J, et al. Application of electrical impedance tomography on water seepage nondestructive testing of cementitious material[J]. Nondestructive Testing, 2017, 39(4): 26-30. | |
| 19 | 孙国中, 孙强. 基于电阻抗成像的土壤测控系统[J]. 科学技术与工程, 2020, 20(13): 5180-5185. |
| Sun G Z, Sun Q. Soil measurement and control system based on electrical resistance imaging[J]. Science Technology and Engineering, 2020, 20(13): 5180-5185. | |
| 20 | 刘宗毓. 面向水质监测的动态电阻抗成像方法研究[D]. 天津: 天津工业大学, 2020. |
| Liu Z Y. Research on dynamic electrical impedance imaging method for water quality monitoring[D]. Tianjin: Tianjin Polytechnic University, 2020. | |
| 21 | 窦唱. 基于阵列阻抗测量的膜完整性智能检测方法研究 [D]. 天津工业大学,2021. |
| Tianjin: Dou C. Research on intelligent detection method of membrane integrity based on array impedance measurement[D]. Tianjin: Tiangong University, 2021. | |
| 22 | 张鹏程. 基于块稀疏的电阻抗成像方法研究[D]. 天津: 天津工业大学, 2019. |
| Zhang P C. Research on electrical impedance imaging method based on block sparseness[D]. Tianjin: Tianjin Polytechnic University, 2019. | |
| 23 | Wang Q, Lian Z J, Wang J M, et al. Accelerated reconstruction of electrical impedance tomography images via patch based sparse representation[J]. The Review of Scientific Instruments, 2016, 87(11): 114707. |
| 24 | 孙丽华, 俞天敏, 田海龙, 等. 典型有机物与超滤膜界面作用及膜污染机制研究[J]. 环境科学学报, 2016, 36(2): 530-536. |
| Sun L H, Yu T M, Tian H L, et al. Interaction of typical organic matters on ultrafiltration membrane and the mechanism of membrane fouling[J]. Acta Scientiae Circumstantiae, 2016, 36(2): 530-536. | |
| 25 | 袁栋栋, 樊耀波, 徐国梁, 等. 玻璃纤维编织管覆膜改性及其动态膜生物反应器研究[J]. 环境科学, 2009, 30(8): 2332-2341. |
| Yuan D D, Fan Y B, Xu G L, et al. Dynamic membrane bioreactor with glass fiber tube covered with organic membrane[J]. Environmental Science, 2009, 30(8): 2332-2341. | |
| 26 | 李俊, 奚旦立, 石勇. 动态膜处理污水时阻力分布及污染机理[J]. 化工学报, 2008, 59(9): 2309-2315. |
| Li J, Xi D L, Shi Y. Resistance distribution and fouling mechanism of dynamic membrane in wastewater treatment[J]. Journal of Chemical Industry and Engineering (China), 2008, 59(9): 2309-2315. | |
| 27 | Ma G, Hao Z L, Wu X, et al. An optimal electrical impedance tomography drive pattern for human-computer interaction applications[J]. IEEE Transactions on Biomedical Circuits and Systems, 2020, 14(3): 402-411. |
| 28 | 王化祥. 电学层析成像技术[J]. 自动化仪表, 2017, 38(5): 1-6. |
| Wang H X. Electrical tomography technology[J]. Process Automation Instrumentation, 2017, 38(5): 1-6. | |
| 29 | Dai H B, Gallo G J, Schumacher T, et al. A novel methodology for spatial damage detection and imaging using a distributed carbon nanotube-based composite sensor combined with electrical impedance tomography[J]. Journal of Nondestructive Evaluation, 2016, 35(2): 1-15. |
| 30 | Riera J, Riu P J, Casan P, et al. Electrical impedance tomography in acute lung injury[J]. Medicina Intensiva (English Edition), 2011, 35(8): 509-517. |
| 31 | 张静婉. 基于深度学习字典的电阻抗稀疏成像算法研究[D]. 天津: 天津工业大学, 2019. |
| Zhang J W. Research on electrical impedance sparse imaging algorithm based on deep learning dictionary[D]. Tianjin: Tianjin Polytechnic University, 2019. | |
| 32 | 房晓东. 电阻抗图像重建算法研究[D]. 天津: 天津科技大学, 2015. |
| Fang X D. Research on image reconstruction algorithm of electrical impedance tomography[D]. Tianjin: Tianjin University of Science & Technology, 2015. | |
| 33 | Wang Q, Dou C, Xin C C, et al. Monitoring of membrane integrity based on electrical measurement and deep learning[J]. IEEE Sensors Journal, 2021, 21(6): 8020-8029. |
| 34 | 唐娟. 混凝-超滤工艺中高分子助凝剂与膜污染物间的“助凝-污染”机制研究[D]. 天津: 天津工业大学, 2020. |
| Tang J. Study on the mechanism of “coagulation aid-fouling” between polymer coagulant aids and membrane pollutants in coagulation-ultrafiltration process[D]. Tianjin: Tiangong University, 2020. | |
| 35 | Zhang W X, Luo J Q, Ding L H, et al. A review on flux decline control strategies in pressure-driven membrane processes[J]. Industrial & Engineering Chemistry Research, 2015, 54(11): 2843-2861. |
| [1] | Yanpeng WU, Xiaoyu LI, Qiaoyang ZHONG. Experimental analysis on filtration performance of electrospun nanofibers with amphiphobic membrane of oily fine particles [J]. CIESC Journal, 2023, 74(S1): 259-264. |
| [2] | Yitong LI, Hang GUO, Hao CHEN, Fang YE. Study on operating conditions of proton exchange membrane fuel cells with non-uniform catalyst distributions [J]. CIESC Journal, 2023, 74(9): 3831-3840. |
| [3] | Jiayi ZHANG, Jiali HE, Jiangpeng XIE, Jian WANG, Yu ZHAO, Dongqiang ZHANG. Research progress of pervaporation technology for N-methylpyrrolidone recovery in lithium battery production [J]. CIESC Journal, 2023, 74(8): 3203-3215. |
| [4] | Yali HU, Junyong HU, Suxia MA, Yukun SUN, Xueyi TAN, Jiaxin HUANG, Fengyuan YANG. Development of novel working fluid and study on electrochemical characteristics of reverse electrodialysis heat engine [J]. CIESC Journal, 2023, 74(8): 3513-3521. |
| [5] | Zhaoguang CHEN, Yuxiang JIA, Meng WANG. Modeling neutralization dialysis desalination driven by low concentration waste acid and its validation [J]. CIESC Journal, 2023, 74(6): 2486-2494. |
| [6] | Kuikui HAN, Xianglong TAN, Jinzhi LI, Ting YANG, Chun ZHANG, Yongfen ZHANG, Hongquan LIU, Zhongwei YU, Xuehong GU. Four-channel hollow fiber MFI zeolite membrane for the separation of xylene isomers [J]. CIESC Journal, 2023, 74(6): 2468-2476. |
| [7] | Lei WANG, Lei WANG, Yunlong BAI, Liuliu HE. Preparation of SA lithium ion sieve membrane and its adsorptive properties [J]. CIESC Journal, 2023, 74(5): 2046-2056. |
| [8] | Lei HUANG, Lingxue KONG, Jin BAI, Huaizhu LI, Zhenxing GUO, Zongqing BAI, Ping LI, Wen LI. Effect of oil shale addition on ash fusion behavior of Zhundong high-sodium coal [J]. CIESC Journal, 2023, 74(5): 2123-2135. |
| [9] | Hao GU, Fujian ZHANG, Zhen LIU, Wenxuan ZHOU, Peng ZHANG, Zhongqiang ZHANG. Desalination performance and mechanism of porous graphene membrane in temporal dimension under mechanical-electrical coupling [J]. CIESC Journal, 2023, 74(5): 2067-2074. |
| [10] | Yongyao SUN, Qiuying GAO, Wenguang ZENG, Jiaming WANG, Yifei CHEN, Yongzhe ZHOU, Gaohong HE, Xuehua RUAN. Design and optimization of membrane-based integration process for advanced utilization of associated gases in N2-EOR oilfields [J]. CIESC Journal, 2023, 74(5): 2034-2045. |
| [11] | Chenxin LI, Yanqiu PAN, Liu HE, Yabin NIU, Lu YU. Carbon membrane model based on carbon microcrystal structure and its gas separation simulation [J]. CIESC Journal, 2023, 74(5): 2057-2066. |
| [12] | Xiaoxuan WANG, Xiaohong HU, Yunan LU, Shiyong WANG, Fengxian FAN. Numerical simulation of flow characteristics in a rotating membrane filter [J]. CIESC Journal, 2023, 74(4): 1489-1498. |
| [13] | Laiming LUO, Jin ZHANG, Zhibin GUO, Haining WANG, Shanfu LU, Yan XIANG. Simulation and experiment of high temperature polymer electrolyte membrane fuel cells stack in the 1—5 kW range [J]. CIESC Journal, 2023, 74(4): 1724-1734. |
| [14] | Rong WANG, Yonghong WANG, Xinru ZHANG, Jinping LI. Construction of 6FDA-based polyimide carbon molecular sieve membranes for gas separation and its application [J]. CIESC Journal, 2023, 74(4): 1433-1445. |
| [15] | Yangguang LYU, Peipei ZUO, Zhengjin YANG, Tongwen XU. Triazine framework polymer membranes for methanol/n-hexane separation via organic solvent nanofiltration [J]. CIESC Journal, 2023, 74(4): 1598-1606. |
| Viewed | ||||||
|
Full text |
|
|||||
|
Abstract |
|
|||||