化工学报 ›› 2024, Vol. 75 ›› Issue (S1): 267-275.DOI: 10.11949/0438-1157.20240448
蒲黎明1( ), 汪贵1, 郑春来1, 王科1, 向腾龙2, 王治红2()
收稿日期:2024-04-24
修回日期:2024-05-31
出版日期:2024-12-25
发布日期:2024-12-17
通讯作者:
王治红
作者简介:蒲黎明(1982—),高级工程师,puliming_sw@swpu.edu.cn
基金资助:
Liming PU1(), Gui WANG1, Chunlai ZHENG1, Ke WANG1, Tenglong XIANG2, Zhihong WANG2()
Received:2024-04-24
Revised:2024-05-31
Online:2024-12-25
Published:2024-12-17
Contact:
Zhihong WANG
摘要:
混合制冷级联(MFC)工艺是大型基地负荷型天然气液化过程最具竞争力的工艺之一,其工艺由天然气预冷、液化和过冷三个混合制冷循环构成,涉及冷剂配比、制冷温度及压力等关键参数,使其过程复杂和敏感。针对MFC液化工艺,建立了以比功耗为目标的优化函数,借助Aspen HYSYS流程模拟与物性计算,采用序列二次规划法(SQP)优化算法对MFC工艺进行全局优化,并对工艺过程进行有效能分析。优化结果表明,全局优化后,MFC液化过程的比功耗为899.36 kJ/kg,降低了7.38%;多股流换热器冷热复合曲线匹配得更好。通过有效能分析发现,制冷压缩机机组的有效能损失占比最大,优化后多股流换热器的有效能损失显著降低,液化过程的有效能效率由38.17%提高到41.21%,能量利用效率提高明显。
中图分类号:
蒲黎明, 汪贵, 郑春来, 王科, 向腾龙, 王治红. 混合制冷级联天然气液化工艺优化及分析[J]. 化工学报, 2024, 75(S1): 267-275.
Liming PU, Gui WANG, Chunlai ZHENG, Ke WANG, Tenglong XIANG, Zhihong WANG. Optimization and analysis of natural gas liquefaction process in mixed fluid cascade[J]. CIESC Journal, 2024, 75(S1): 267-275.
| CH2 | C2H6 | C3H8 | iC4H10 | nC4H10 | N2 | H2+He |
|---|---|---|---|---|---|---|
| 0.9481 | 0.0311 | 0.0085 | 0.0024 | 0.0017 | 0.0076 | 0.0006 |
表1 天然气组成(摩尔分数)
Table 1 Natural gas composition(mole fraction)
| CH2 | C2H6 | C3H8 | iC4H10 | nC4H10 | N2 | H2+He |
|---|---|---|---|---|---|---|
| 0.9481 | 0.0311 | 0.0085 | 0.0024 | 0.0017 | 0.0076 | 0.0006 |
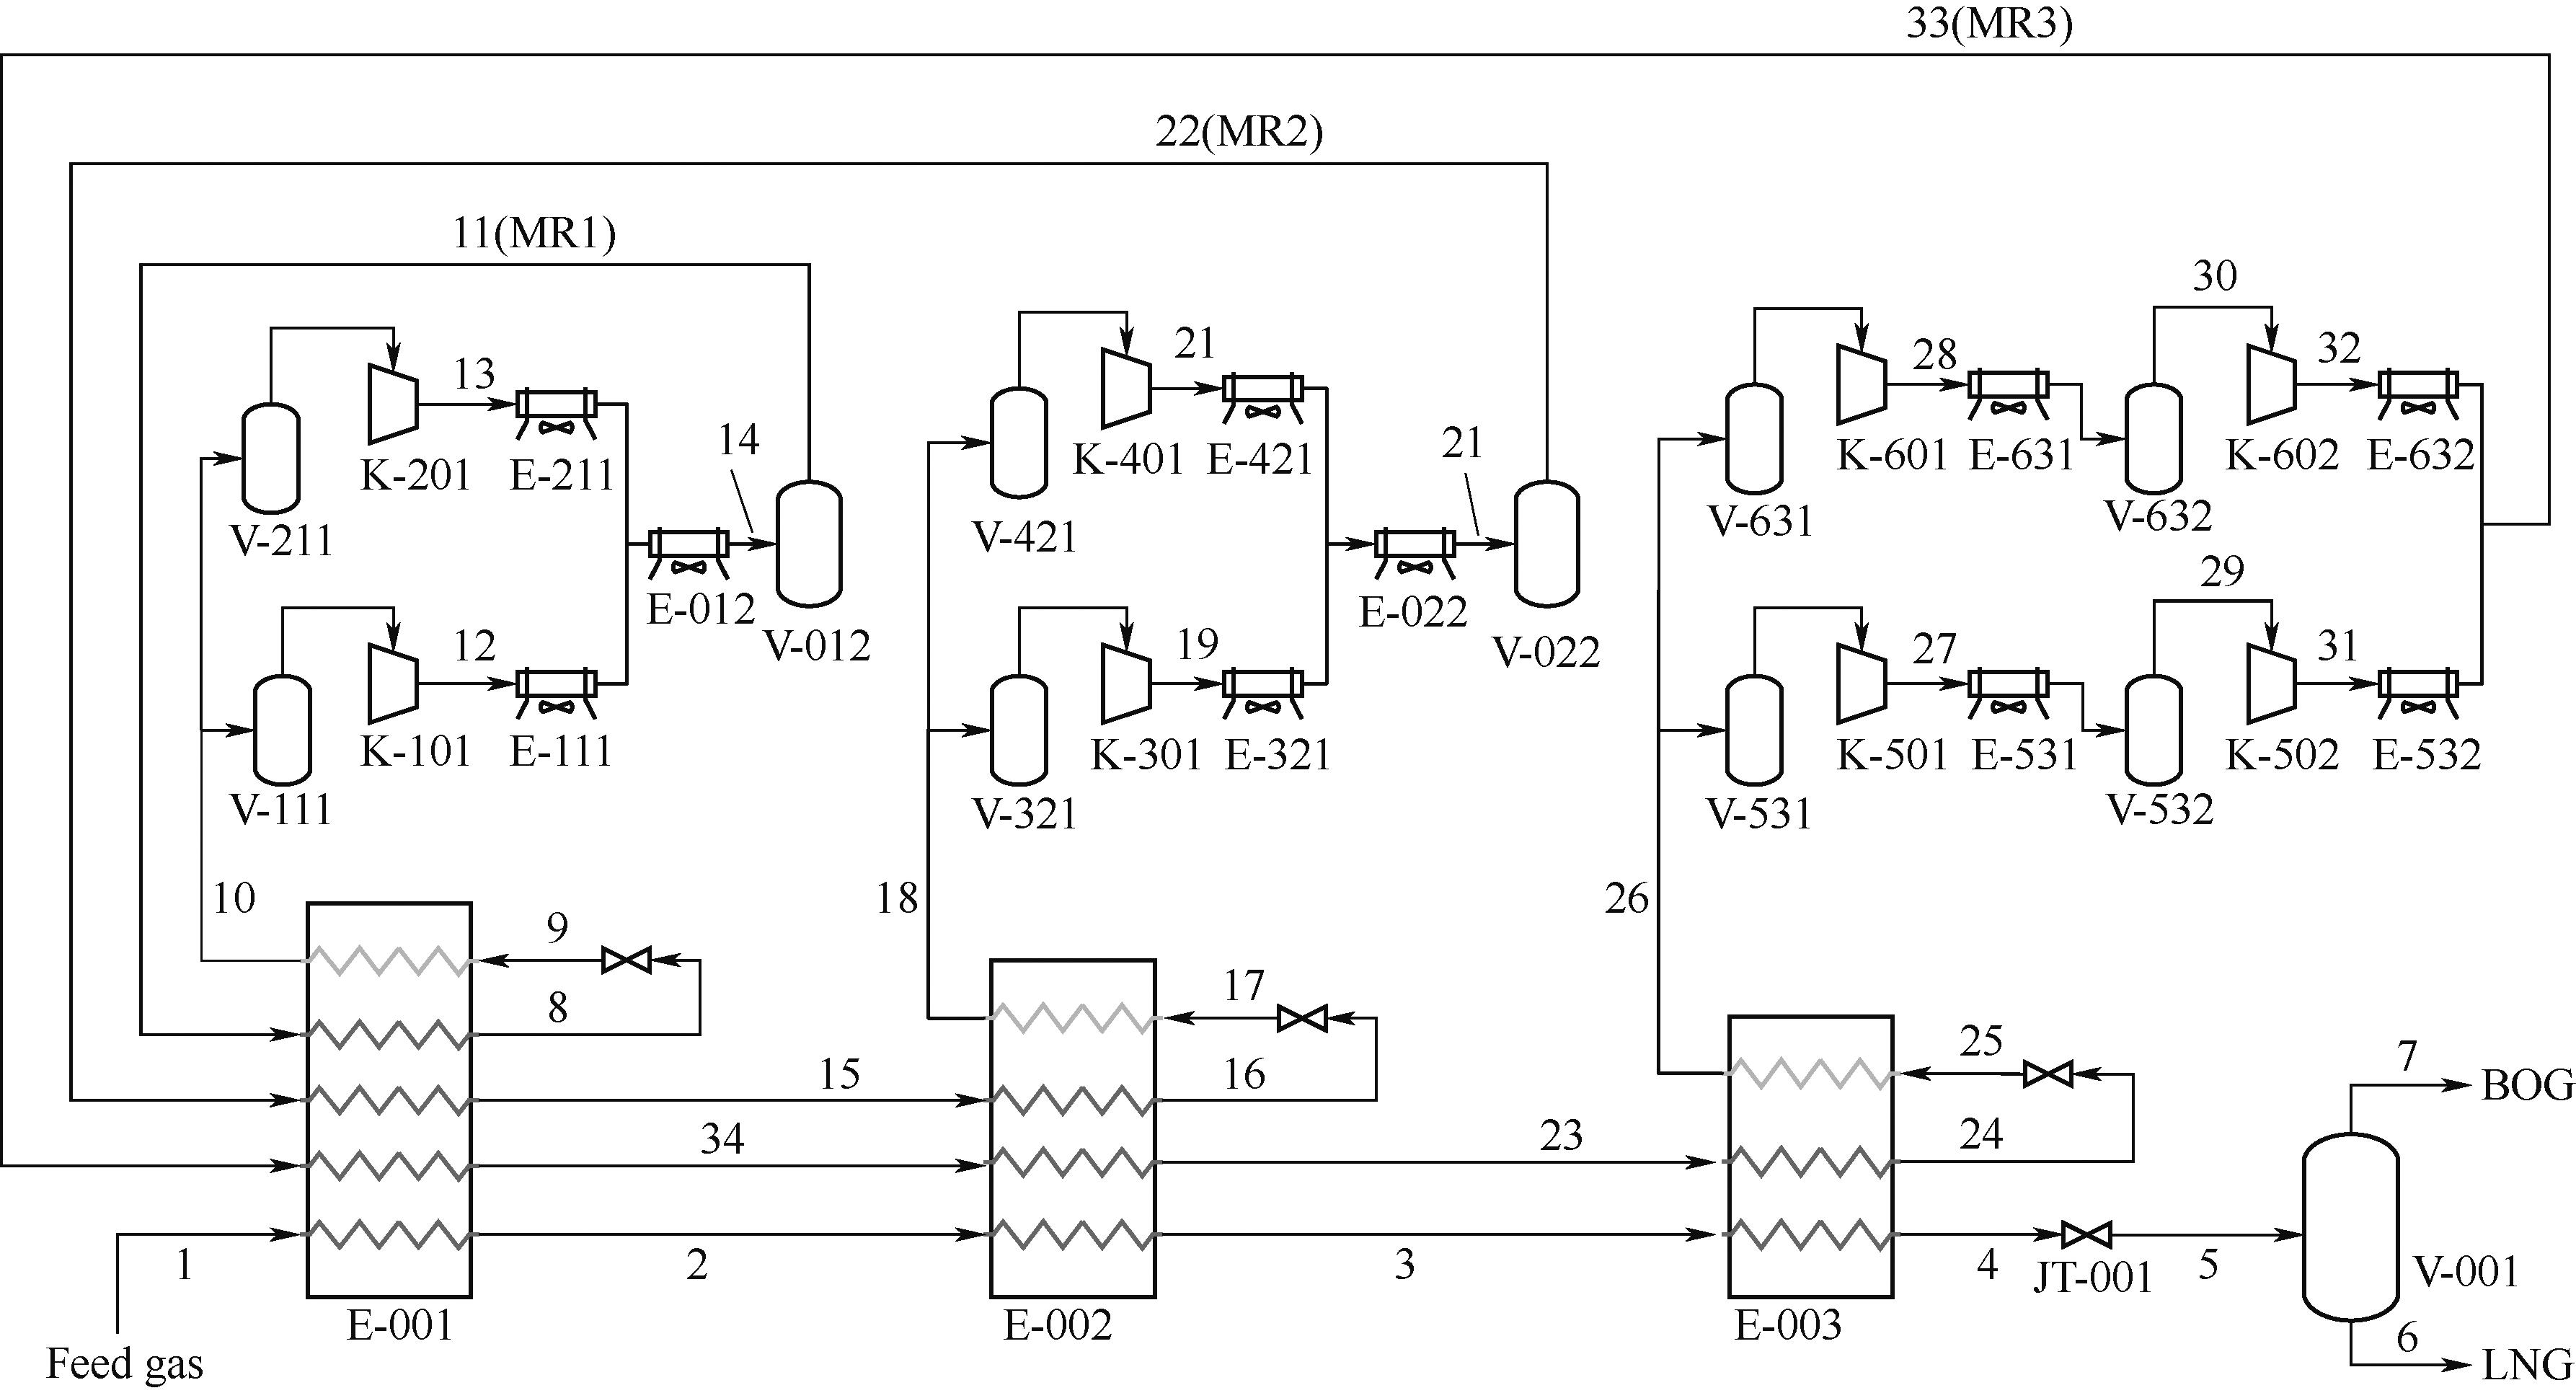
图1 MFC天然气液化工艺流程
Fig.1 MFC natural gas liquefaction process flow
| 编号 | 气相分数 | 温度/℃ | 压力/MPa | 摩尔流量/(kmol/h) | 质量流量/(kg/h) | 质量焓/(kJ/kg) | 质量熵/(kJ/(kg·K)) | 质量有效能/(kJ/kg) |
|---|---|---|---|---|---|---|---|---|
| 1 | 1.00 | 22.00 | 8.50 | 53740.43 | 910695.00 | -4535.77 | 8.50 | 620.46 |
| 2 | 1.00 | -35.35 | 7.98 | 53740.43 | 910695.00 | -4720.45 | 7.82 | 637.88 |
| 3 | 0.00 | -71.55 | 7.73 | 53740.43 | 910695.00 | -4952.25 | 6.77 | 721.49 |
| 4 | 0.00 | -155.00 | 5.18 | 41168.33 | 934825.83 | -3734.10 | 3.41 | 739.97 |
| 5 | 0.04 | -156.88 | 0.61 | 41168.33 | 934825.83 | -3734.10 | 3.48 | 720.48 |
| 6 | 0.00 | -159.29 | 0.20 | 51443.44 | 871752.12 | -5336.94 | 4.59 | 1008.16 |
| 7 | 1.00 | -159.29 | 0.20 | 2296.99 | 38942.88 | -4328.54 | 8.74 | 237.92 |
| 8 | 0.00 | -35.35 | 1.10 | 36717.32 | 1493609.51 | -2991.72 | 2.23 | 165.59 |
| 9 | 0.02 | -38.35 | 0.39 | 36717.32 | 1493609.51 | -2991.72 | 2.24 | 164.02 |
| 10 | 1.00 | 18.00 | 0.33 | 36717.32 | 1493609.51 | -2497.90 | 4.21 | 70.83 |
| 11 | 0.01 | 13.76 | 1.57 | 36717.32 | 1493609.51 | -2862.16 | 2.72 | 149.29 |
| 12 | 1.00 | 102.59 | 1.78 | 18358.66 | 746804.76 | -2364.32 | 4.30 | 177.36 |
| 13 | 1.00 | 102.59 | 1.78 | 18358.66 | 746804.76 | -2364.32 | 4.30 | 177.36 |
| 14 | 0.00 | 15.00 | 1.64 | 36717.32 | 1493609.51 | -2862.16 | 2.72 | 149.43 |
| 15 | 0.00 | -35.35 | 3.81 | 31557.60 | 952561.51 | -3373.16 | 3.75 | 298.71 |
| 16 | 0.00 | -71.55 | 3.49 | 31557.60 | 952561.51 | -3468.55 | 3.32 | 332.00 |
| 17 | 0.09 | -81.50 | 0.41 | 31557.60 | 952561.51 | -3468.55 | 3.35 | 321.07 |
| 18 | 1.00 | -41.33 | 3.44 | 31557.60 | 952561.51 | -2973.78 | 5.71 | 113.16 |
| 19 | 1.00 | 118.24 | 4.44 | 15778.80 | 476280.76 | -2731.08 | 5.87 | 308.13 |
| 20 | 1.00 | 118.24 | 4.44 | 15778.80 | 476280.76 | -2731.08 | 5.87 | 308.13 |
| 21 | 0.10 | 15.00 | 4.30 | 31557.60 | 952561.51 | -3180.07 | 4.47 | 276.64 |
| 22 | 0.11 | 14.62 | 4.25 | 31557.60 | 952561.51 | -3180.07 | 4.47 | 276.46 |
| 23 | 0.01 | -71.55 | 6.18 | 41168.33 | 934825.83 | -3492.25 | 4.93 | 529.36 |
| 24 | 0.00 | -156.00 | 5.18 | 41168.33 | 934825.83 | -3734.10 | 3.41 | 739.97 |
| 25 | 0.09 | -160.80 | 0.39 | 41168.33 | 934825.83 | -3734.10 | 3.49 | 716.69 |
| 26 | 1.00 | -74.54 | 0.35 | 41168.33 | 934825.83 | -3159.50 | 7.25 | 169.53 |
| 27 | 1.00 | 93.38 | 3.45 | 20584.16 | 467412.91 | -2883.56 | 7.45 | 386.71 |
| 28 | 1.00 | 93.38 | 3.45 | 20584.16 | 467412.91 | -2883.56 | 7.45 | 386.71 |
| 29 | 1.00 | 15.30 | 3.39 | 20584.16 | 467412.91 | -3046.81 | 6.95 | 370.95 |
| 30 | 1.00 | 15.30 | 3.39 | 20584.16 | 467412.91 | -3046.81 | 6.95 | 370.95 |
| 31 | 1.00 | 80.81 | 7.31 | 20584.16 | 467412.91 | -2944.79 | 7.03 | 451.15 |
| 32 | 1.00 | 80.81 | 7.31 | 20584.16 | 467412.91 | -2944.79 | 7.03 | 451.15 |
| 33 | 1.00 | 14.70 | 7.19 | 41168.33 | 934825.83 | -3105.54 | 6.53 | 439.16 |
| 34 | 0.57 | -35.35 | 6.79 | 41168.33 | 934825.83 | -3311.12 | 5.74 | 468.11 |
表2 模拟流股热力学数据
Table 2 Simulated flow strand thermodynamic data
| 编号 | 气相分数 | 温度/℃ | 压力/MPa | 摩尔流量/(kmol/h) | 质量流量/(kg/h) | 质量焓/(kJ/kg) | 质量熵/(kJ/(kg·K)) | 质量有效能/(kJ/kg) |
|---|---|---|---|---|---|---|---|---|
| 1 | 1.00 | 22.00 | 8.50 | 53740.43 | 910695.00 | -4535.77 | 8.50 | 620.46 |
| 2 | 1.00 | -35.35 | 7.98 | 53740.43 | 910695.00 | -4720.45 | 7.82 | 637.88 |
| 3 | 0.00 | -71.55 | 7.73 | 53740.43 | 910695.00 | -4952.25 | 6.77 | 721.49 |
| 4 | 0.00 | -155.00 | 5.18 | 41168.33 | 934825.83 | -3734.10 | 3.41 | 739.97 |
| 5 | 0.04 | -156.88 | 0.61 | 41168.33 | 934825.83 | -3734.10 | 3.48 | 720.48 |
| 6 | 0.00 | -159.29 | 0.20 | 51443.44 | 871752.12 | -5336.94 | 4.59 | 1008.16 |
| 7 | 1.00 | -159.29 | 0.20 | 2296.99 | 38942.88 | -4328.54 | 8.74 | 237.92 |
| 8 | 0.00 | -35.35 | 1.10 | 36717.32 | 1493609.51 | -2991.72 | 2.23 | 165.59 |
| 9 | 0.02 | -38.35 | 0.39 | 36717.32 | 1493609.51 | -2991.72 | 2.24 | 164.02 |
| 10 | 1.00 | 18.00 | 0.33 | 36717.32 | 1493609.51 | -2497.90 | 4.21 | 70.83 |
| 11 | 0.01 | 13.76 | 1.57 | 36717.32 | 1493609.51 | -2862.16 | 2.72 | 149.29 |
| 12 | 1.00 | 102.59 | 1.78 | 18358.66 | 746804.76 | -2364.32 | 4.30 | 177.36 |
| 13 | 1.00 | 102.59 | 1.78 | 18358.66 | 746804.76 | -2364.32 | 4.30 | 177.36 |
| 14 | 0.00 | 15.00 | 1.64 | 36717.32 | 1493609.51 | -2862.16 | 2.72 | 149.43 |
| 15 | 0.00 | -35.35 | 3.81 | 31557.60 | 952561.51 | -3373.16 | 3.75 | 298.71 |
| 16 | 0.00 | -71.55 | 3.49 | 31557.60 | 952561.51 | -3468.55 | 3.32 | 332.00 |
| 17 | 0.09 | -81.50 | 0.41 | 31557.60 | 952561.51 | -3468.55 | 3.35 | 321.07 |
| 18 | 1.00 | -41.33 | 3.44 | 31557.60 | 952561.51 | -2973.78 | 5.71 | 113.16 |
| 19 | 1.00 | 118.24 | 4.44 | 15778.80 | 476280.76 | -2731.08 | 5.87 | 308.13 |
| 20 | 1.00 | 118.24 | 4.44 | 15778.80 | 476280.76 | -2731.08 | 5.87 | 308.13 |
| 21 | 0.10 | 15.00 | 4.30 | 31557.60 | 952561.51 | -3180.07 | 4.47 | 276.64 |
| 22 | 0.11 | 14.62 | 4.25 | 31557.60 | 952561.51 | -3180.07 | 4.47 | 276.46 |
| 23 | 0.01 | -71.55 | 6.18 | 41168.33 | 934825.83 | -3492.25 | 4.93 | 529.36 |
| 24 | 0.00 | -156.00 | 5.18 | 41168.33 | 934825.83 | -3734.10 | 3.41 | 739.97 |
| 25 | 0.09 | -160.80 | 0.39 | 41168.33 | 934825.83 | -3734.10 | 3.49 | 716.69 |
| 26 | 1.00 | -74.54 | 0.35 | 41168.33 | 934825.83 | -3159.50 | 7.25 | 169.53 |
| 27 | 1.00 | 93.38 | 3.45 | 20584.16 | 467412.91 | -2883.56 | 7.45 | 386.71 |
| 28 | 1.00 | 93.38 | 3.45 | 20584.16 | 467412.91 | -2883.56 | 7.45 | 386.71 |
| 29 | 1.00 | 15.30 | 3.39 | 20584.16 | 467412.91 | -3046.81 | 6.95 | 370.95 |
| 30 | 1.00 | 15.30 | 3.39 | 20584.16 | 467412.91 | -3046.81 | 6.95 | 370.95 |
| 31 | 1.00 | 80.81 | 7.31 | 20584.16 | 467412.91 | -2944.79 | 7.03 | 451.15 |
| 32 | 1.00 | 80.81 | 7.31 | 20584.16 | 467412.91 | -2944.79 | 7.03 | 451.15 |
| 33 | 1.00 | 14.70 | 7.19 | 41168.33 | 934825.83 | -3105.54 | 6.53 | 439.16 |
| 34 | 0.57 | -35.35 | 6.79 | 41168.33 | 934825.83 | -3311.12 | 5.74 | 468.11 |
| 关键/决策变量 | 单位 | 下限 | 上限 | |
|---|---|---|---|---|
| 过冷循环 | 高压压力p31 | MPa | 6.00 | 8.50 |
| 制冷压力p25 | MPa | 0.20 | 0.60 | |
| 过冷温度T24 | ℃ | -140.00 | -160.00 | |
| N2流率 | kmol/h | 5500 | 6200 | |
| CH4流率 | kmol/h | 18000 | 25000 | |
| C2H6流率 | kmol/h | 12000 | 18000 | |
| 液化循环 | 高压压力p19 | MPa | 4.00 | 5.00 |
| 制冷压力p17 | MPa | 0.20 | 0.60 | |
| 液化温度T16 | ℃ | -60.00 | -85.00 | |
| CH4流率 | kmol/h | 4000 | 5000 | |
| C2H6流率 | kmol/h | 20000 | 30000 | |
| C3H8流率 | kmol/h | 3200 | 4500 | |
| 预冷循环 | 高压压力p12 | MPa | 1.50 | 2.50 |
| 制冷压力p9 | MPa | 0.20 | 0.60 | |
| 预冷温度T8 | ℃ | -27.00 | -40.00 | |
| C2H6流率 | kmol/h | 15000 | 18000 | |
| C3H8流率 | kmol/h | 12000 | 18000 | |
| C4H10流率 | kmol/h | 6000 | 9000 | |
表3 MFC工艺的关键/决策变量下限和上限
Table 3 Lower and upper bounds of key/decision variables for the MFC process
| 关键/决策变量 | 单位 | 下限 | 上限 | |
|---|---|---|---|---|
| 过冷循环 | 高压压力p31 | MPa | 6.00 | 8.50 |
| 制冷压力p25 | MPa | 0.20 | 0.60 | |
| 过冷温度T24 | ℃ | -140.00 | -160.00 | |
| N2流率 | kmol/h | 5500 | 6200 | |
| CH4流率 | kmol/h | 18000 | 25000 | |
| C2H6流率 | kmol/h | 12000 | 18000 | |
| 液化循环 | 高压压力p19 | MPa | 4.00 | 5.00 |
| 制冷压力p17 | MPa | 0.20 | 0.60 | |
| 液化温度T16 | ℃ | -60.00 | -85.00 | |
| CH4流率 | kmol/h | 4000 | 5000 | |
| C2H6流率 | kmol/h | 20000 | 30000 | |
| C3H8流率 | kmol/h | 3200 | 4500 | |
| 预冷循环 | 高压压力p12 | MPa | 1.50 | 2.50 |
| 制冷压力p9 | MPa | 0.20 | 0.60 | |
| 预冷温度T8 | ℃ | -27.00 | -40.00 | |
| C2H6流率 | kmol/h | 15000 | 18000 | |
| C3H8流率 | kmol/h | 12000 | 18000 | |
| C4H10流率 | kmol/h | 6000 | 9000 | |
| 关键参数 | 单位 | 优化前 | 优化后 | |
|---|---|---|---|---|
| 过冷循环 | 高压压力p31 | MPa | 8.46 | 7.31 |
| 制冷压力p25 | MPa | 0.41 | 0.38 | |
| 过冷温度T24 | ℃ | -156.00 | -156.00 | |
| 过热温度T26 | ℃ | -69.93 | -74.54 | |
| 液化循环 | 高压压力p19 | MPa | 4.24 | 4.44 |
| 制冷压力p17 | MPa | 0.44 | 0.41 | |
| 液化温度T16 | ℃ | -65.50 | -71.55 | |
| 过热温度T18 | ℃ | -42.01 | -41.33 | |
| 预冷循环 | 高压压力p12 | MPa | 2.50 | 1.78 |
| 制冷压力p9 | MPa | 0.57 | 0.39 | |
| 预冷温度T8 | ℃ | -30.50 | -35.35 | |
| 过热温度T10 | ℃ | 11.96 | 18.00 | |
表4 优化前后液化工艺的关键参数对比
Table 4 Comparison of key parameters of liquefaction process before and after optimization
| 关键参数 | 单位 | 优化前 | 优化后 | |
|---|---|---|---|---|
| 过冷循环 | 高压压力p31 | MPa | 8.46 | 7.31 |
| 制冷压力p25 | MPa | 0.41 | 0.38 | |
| 过冷温度T24 | ℃ | -156.00 | -156.00 | |
| 过热温度T26 | ℃ | -69.93 | -74.54 | |
| 液化循环 | 高压压力p19 | MPa | 4.24 | 4.44 |
| 制冷压力p17 | MPa | 0.44 | 0.41 | |
| 液化温度T16 | ℃ | -65.50 | -71.55 | |
| 过热温度T18 | ℃ | -42.01 | -41.33 | |
| 预冷循环 | 高压压力p12 | MPa | 2.50 | 1.78 |
| 制冷压力p9 | MPa | 0.57 | 0.39 | |
| 预冷温度T8 | ℃ | -30.50 | -35.35 | |
| 过热温度T10 | ℃ | 11.96 | 18.00 | |
| 冷剂组成及循环量 | 优化前 | 优化后 | |
|---|---|---|---|
| 混合制冷剂MR1 | 循环量/(kmol/)h | 42457.92 | 36717.32 |
| C2H6 | 0.648638 | 0.454331 | |
| C3H8 | 0.183213 | 0.335035 | |
| C4H10 | 0.168149 | 0.210633 | |
| 混合制冷剂MR2 | 循环量/(kmol/h) | 31114.37 | 31557.60 |
| CH4 | 0.088813 | 0.128623 | |
| C2H6 | 0.800945 | 0.739691 | |
| C3H8 | 0.110242 | 0.131686 | |
| 混合制冷剂MR3 | 循环量/(kmol/h) | 47319.36 | 41168.33 |
| N2 | 0.149387 | 0.142229 | |
| CH4 | 0.479987 | 0.507300 | |
| C2H6 | 0.370626 | 0.350471 | |
表5 优化后的混合制冷剂组成(摩尔分数)及循环量
Table 5 Optimized refrigerant blend composition (mole fraction) and flow rate
| 冷剂组成及循环量 | 优化前 | 优化后 | |
|---|---|---|---|
| 混合制冷剂MR1 | 循环量/(kmol/)h | 42457.92 | 36717.32 |
| C2H6 | 0.648638 | 0.454331 | |
| C3H8 | 0.183213 | 0.335035 | |
| C4H10 | 0.168149 | 0.210633 | |
| 混合制冷剂MR2 | 循环量/(kmol/h) | 31114.37 | 31557.60 |
| CH4 | 0.088813 | 0.128623 | |
| C2H6 | 0.800945 | 0.739691 | |
| C3H8 | 0.110242 | 0.131686 | |
| 混合制冷剂MR3 | 循环量/(kmol/h) | 47319.36 | 41168.33 |
| N2 | 0.149387 | 0.142229 | |
| CH4 | 0.479987 | 0.507300 | |
| C2H6 | 0.370626 | 0.350471 | |
| 换热器优化变量 | 单位 | 优化前 | 优化后 | |
|---|---|---|---|---|
| 比功耗 | 单位质量LNG | kJ/kg | 970.99 | 899.36 |
| 预冷换热器E-001 | 最小传热温差 | ℃ | 5.97 | 3.00 |
| 对数平均温差 | ℃ | 12.72 | 7.65 | |
| 液化换热器E-002 | 最小传热温差 | ℃ | 3.63 | 3.00 |
| 对数平均温差 | ℃ | 7.20 | 5.47 | |
| 过冷换热器E-003 | 最小传热温差 | ℃ | 3.20 | 3.00 |
| 对数平均温差 | ℃ | 5.87 | 4.95 | |
表6 优化前后工艺比功耗及换热器性能指标
Table 6 Process specific power consumption and heat exchanger performance index before and after optimization
| 换热器优化变量 | 单位 | 优化前 | 优化后 | |
|---|---|---|---|---|
| 比功耗 | 单位质量LNG | kJ/kg | 970.99 | 899.36 |
| 预冷换热器E-001 | 最小传热温差 | ℃ | 5.97 | 3.00 |
| 对数平均温差 | ℃ | 12.72 | 7.65 | |
| 液化换热器E-002 | 最小传热温差 | ℃ | 3.63 | 3.00 |
| 对数平均温差 | ℃ | 7.20 | 5.47 | |
| 过冷换热器E-003 | 最小传热温差 | ℃ | 3.20 | 3.00 |
| 对数平均温差 | ℃ | 5.87 | 4.95 | |
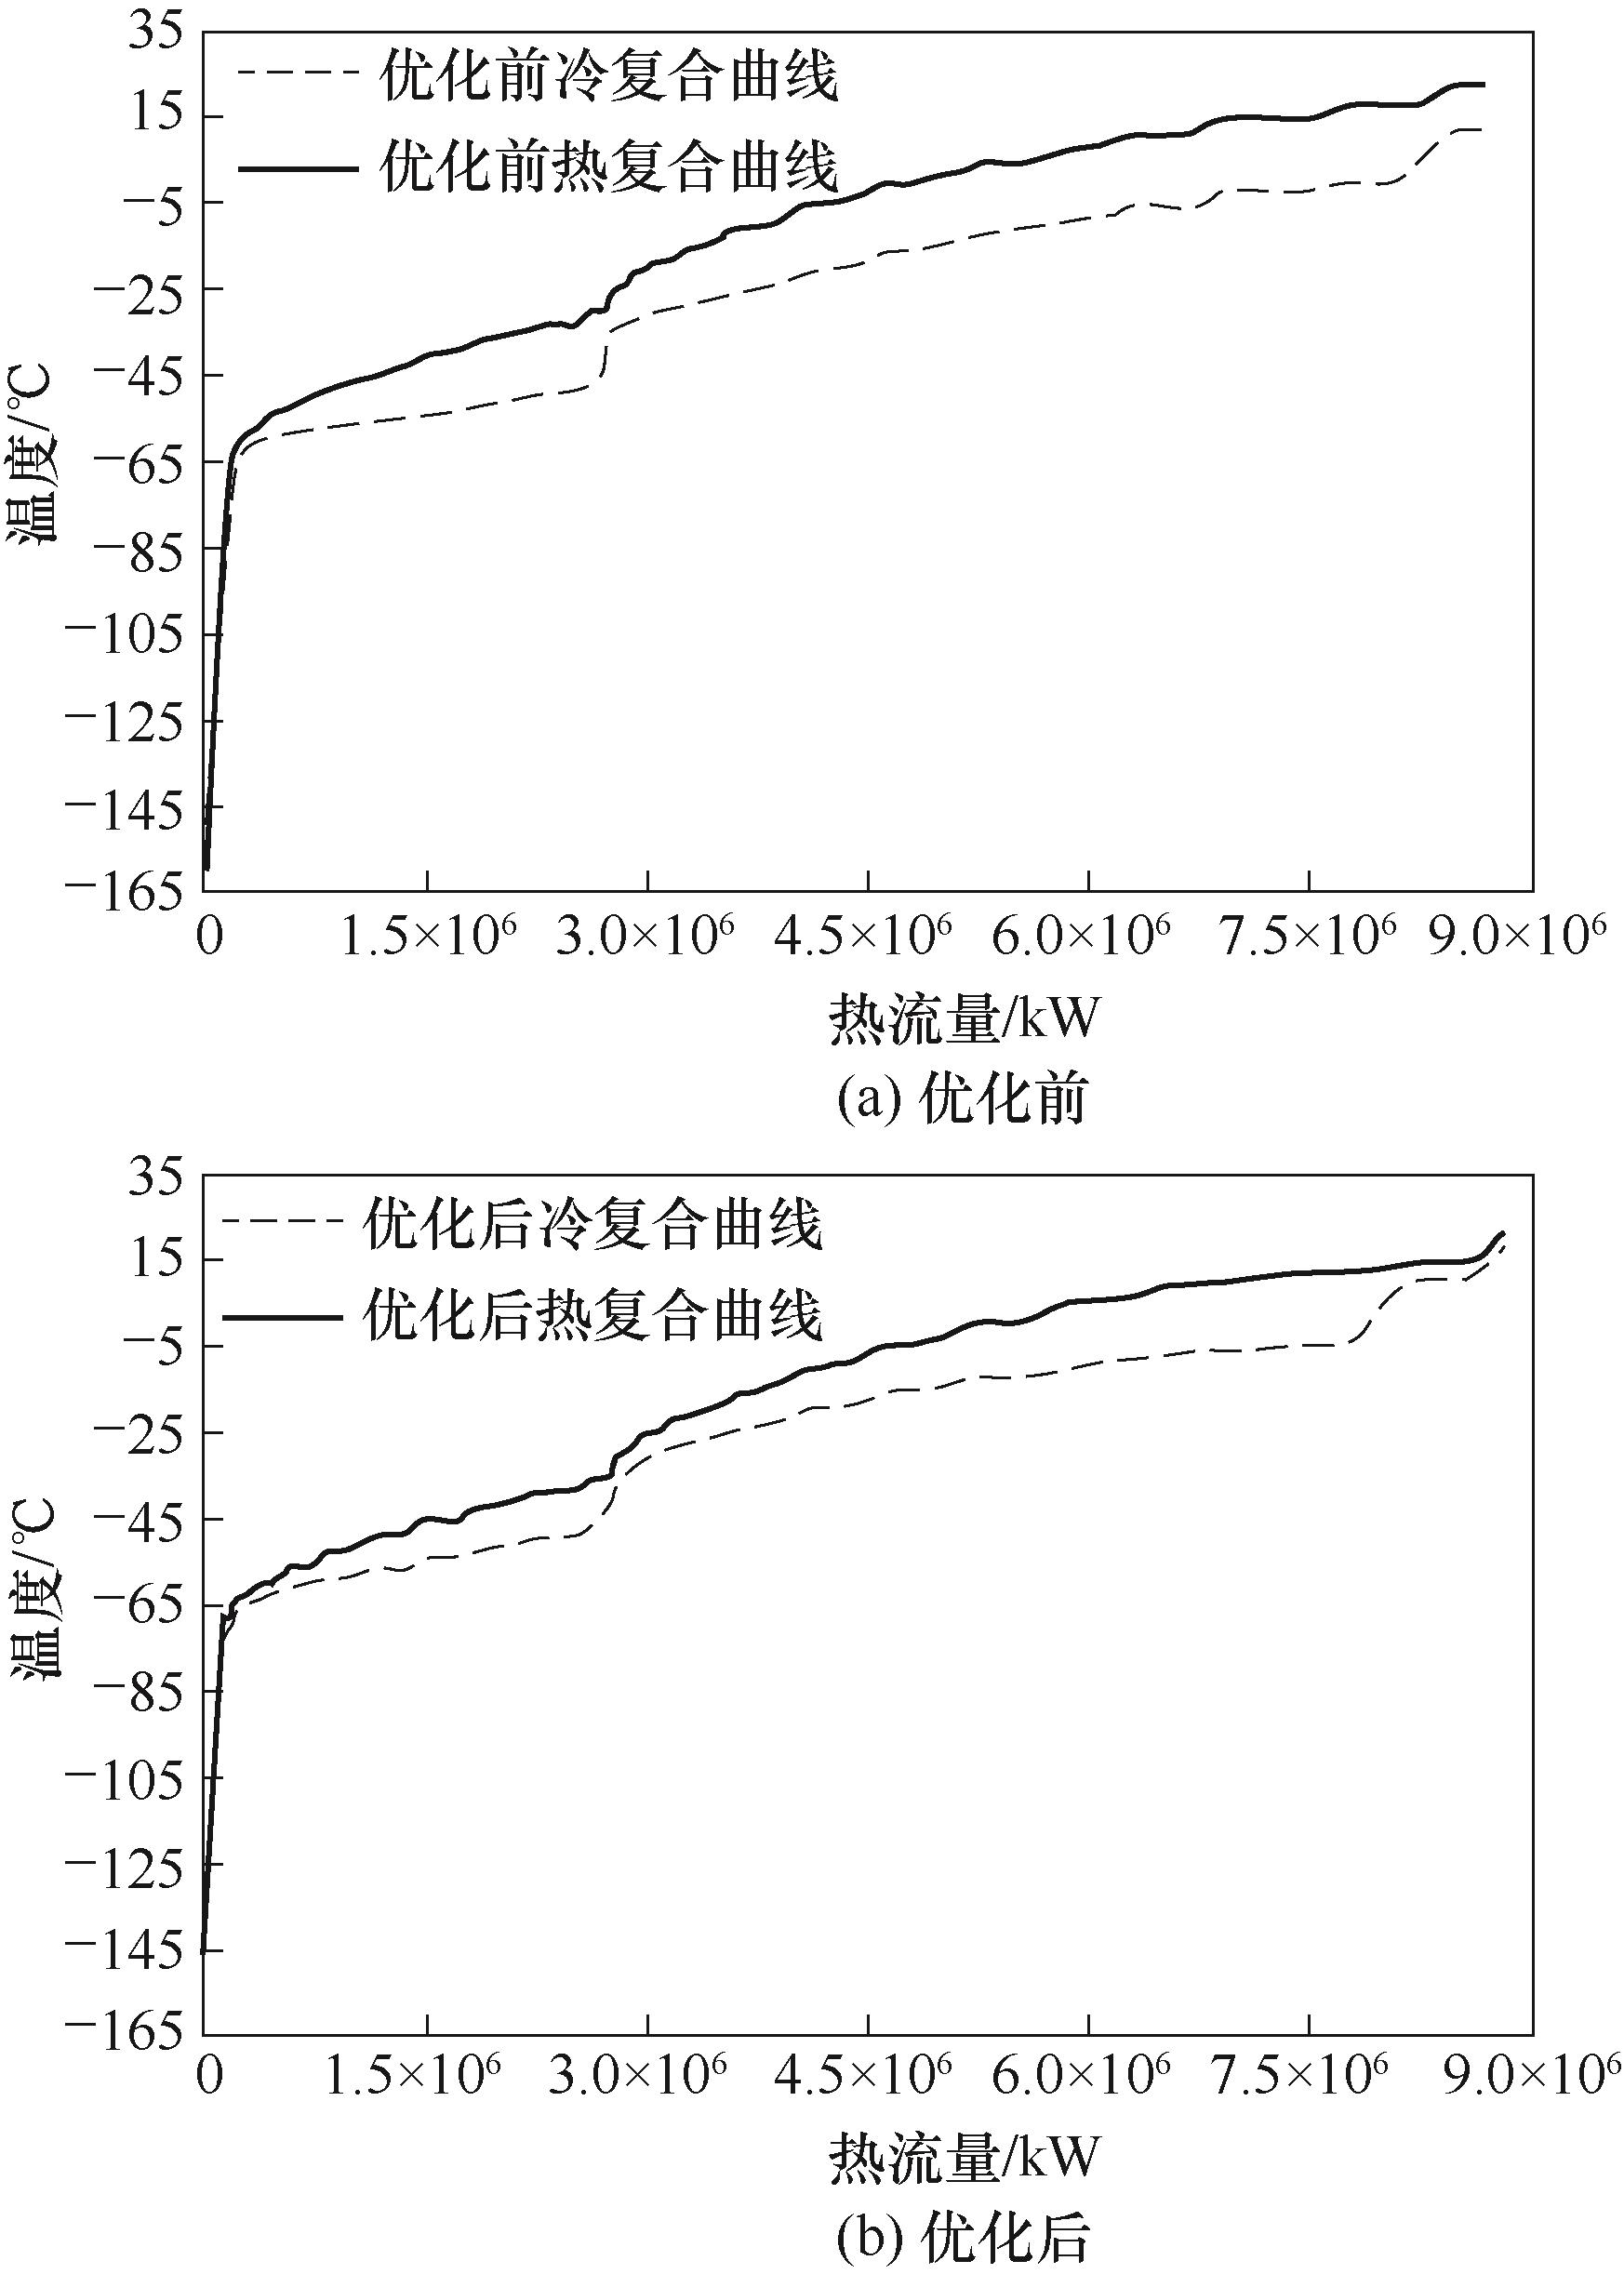
图2 MFC天然气液化工艺优化前后冷热复合曲线
Fig.2 Cold-heat composite curve before and after optimization of MFC natural gas liquefaction process
| 单元系统 | 功耗/kW | 物流 | 有效能/kW | ||
|---|---|---|---|---|---|
| 优化前 | 优化后 | 优化前 | 优化后 | ||
| 合计 | 235128.70 | 217782.94 | 有效能效率/% | 38.17 | 41.21 |
| 预冷循环 | 58356.77 | 55419.98 | 天然气进 | 156957.83 | 156957.83 |
| 液化循环 | 59123.69 | 64217.44 | LNG离开 | 246703.67 | 246703.67 |
| 过冷循环 | 117648.24 | 98145.52 | 有效能变化 | 89745.84 | 89745.84 |
表7 优化前后MFC液化过程的功耗及有效能
Table 7 Power consumption and effective energy of MFC liquefaction process before and after optimization
| 单元系统 | 功耗/kW | 物流 | 有效能/kW | ||
|---|---|---|---|---|---|
| 优化前 | 优化后 | 优化前 | 优化后 | ||
| 合计 | 235128.70 | 217782.94 | 有效能效率/% | 38.17 | 41.21 |
| 预冷循环 | 58356.77 | 55419.98 | 天然气进 | 156957.83 | 156957.83 |
| 液化循环 | 59123.69 | 64217.44 | LNG离开 | 246703.67 | 246703.67 |
| 过冷循环 | 117648.24 | 98145.52 | 有效能变化 | 89745.84 | 89745.84 |
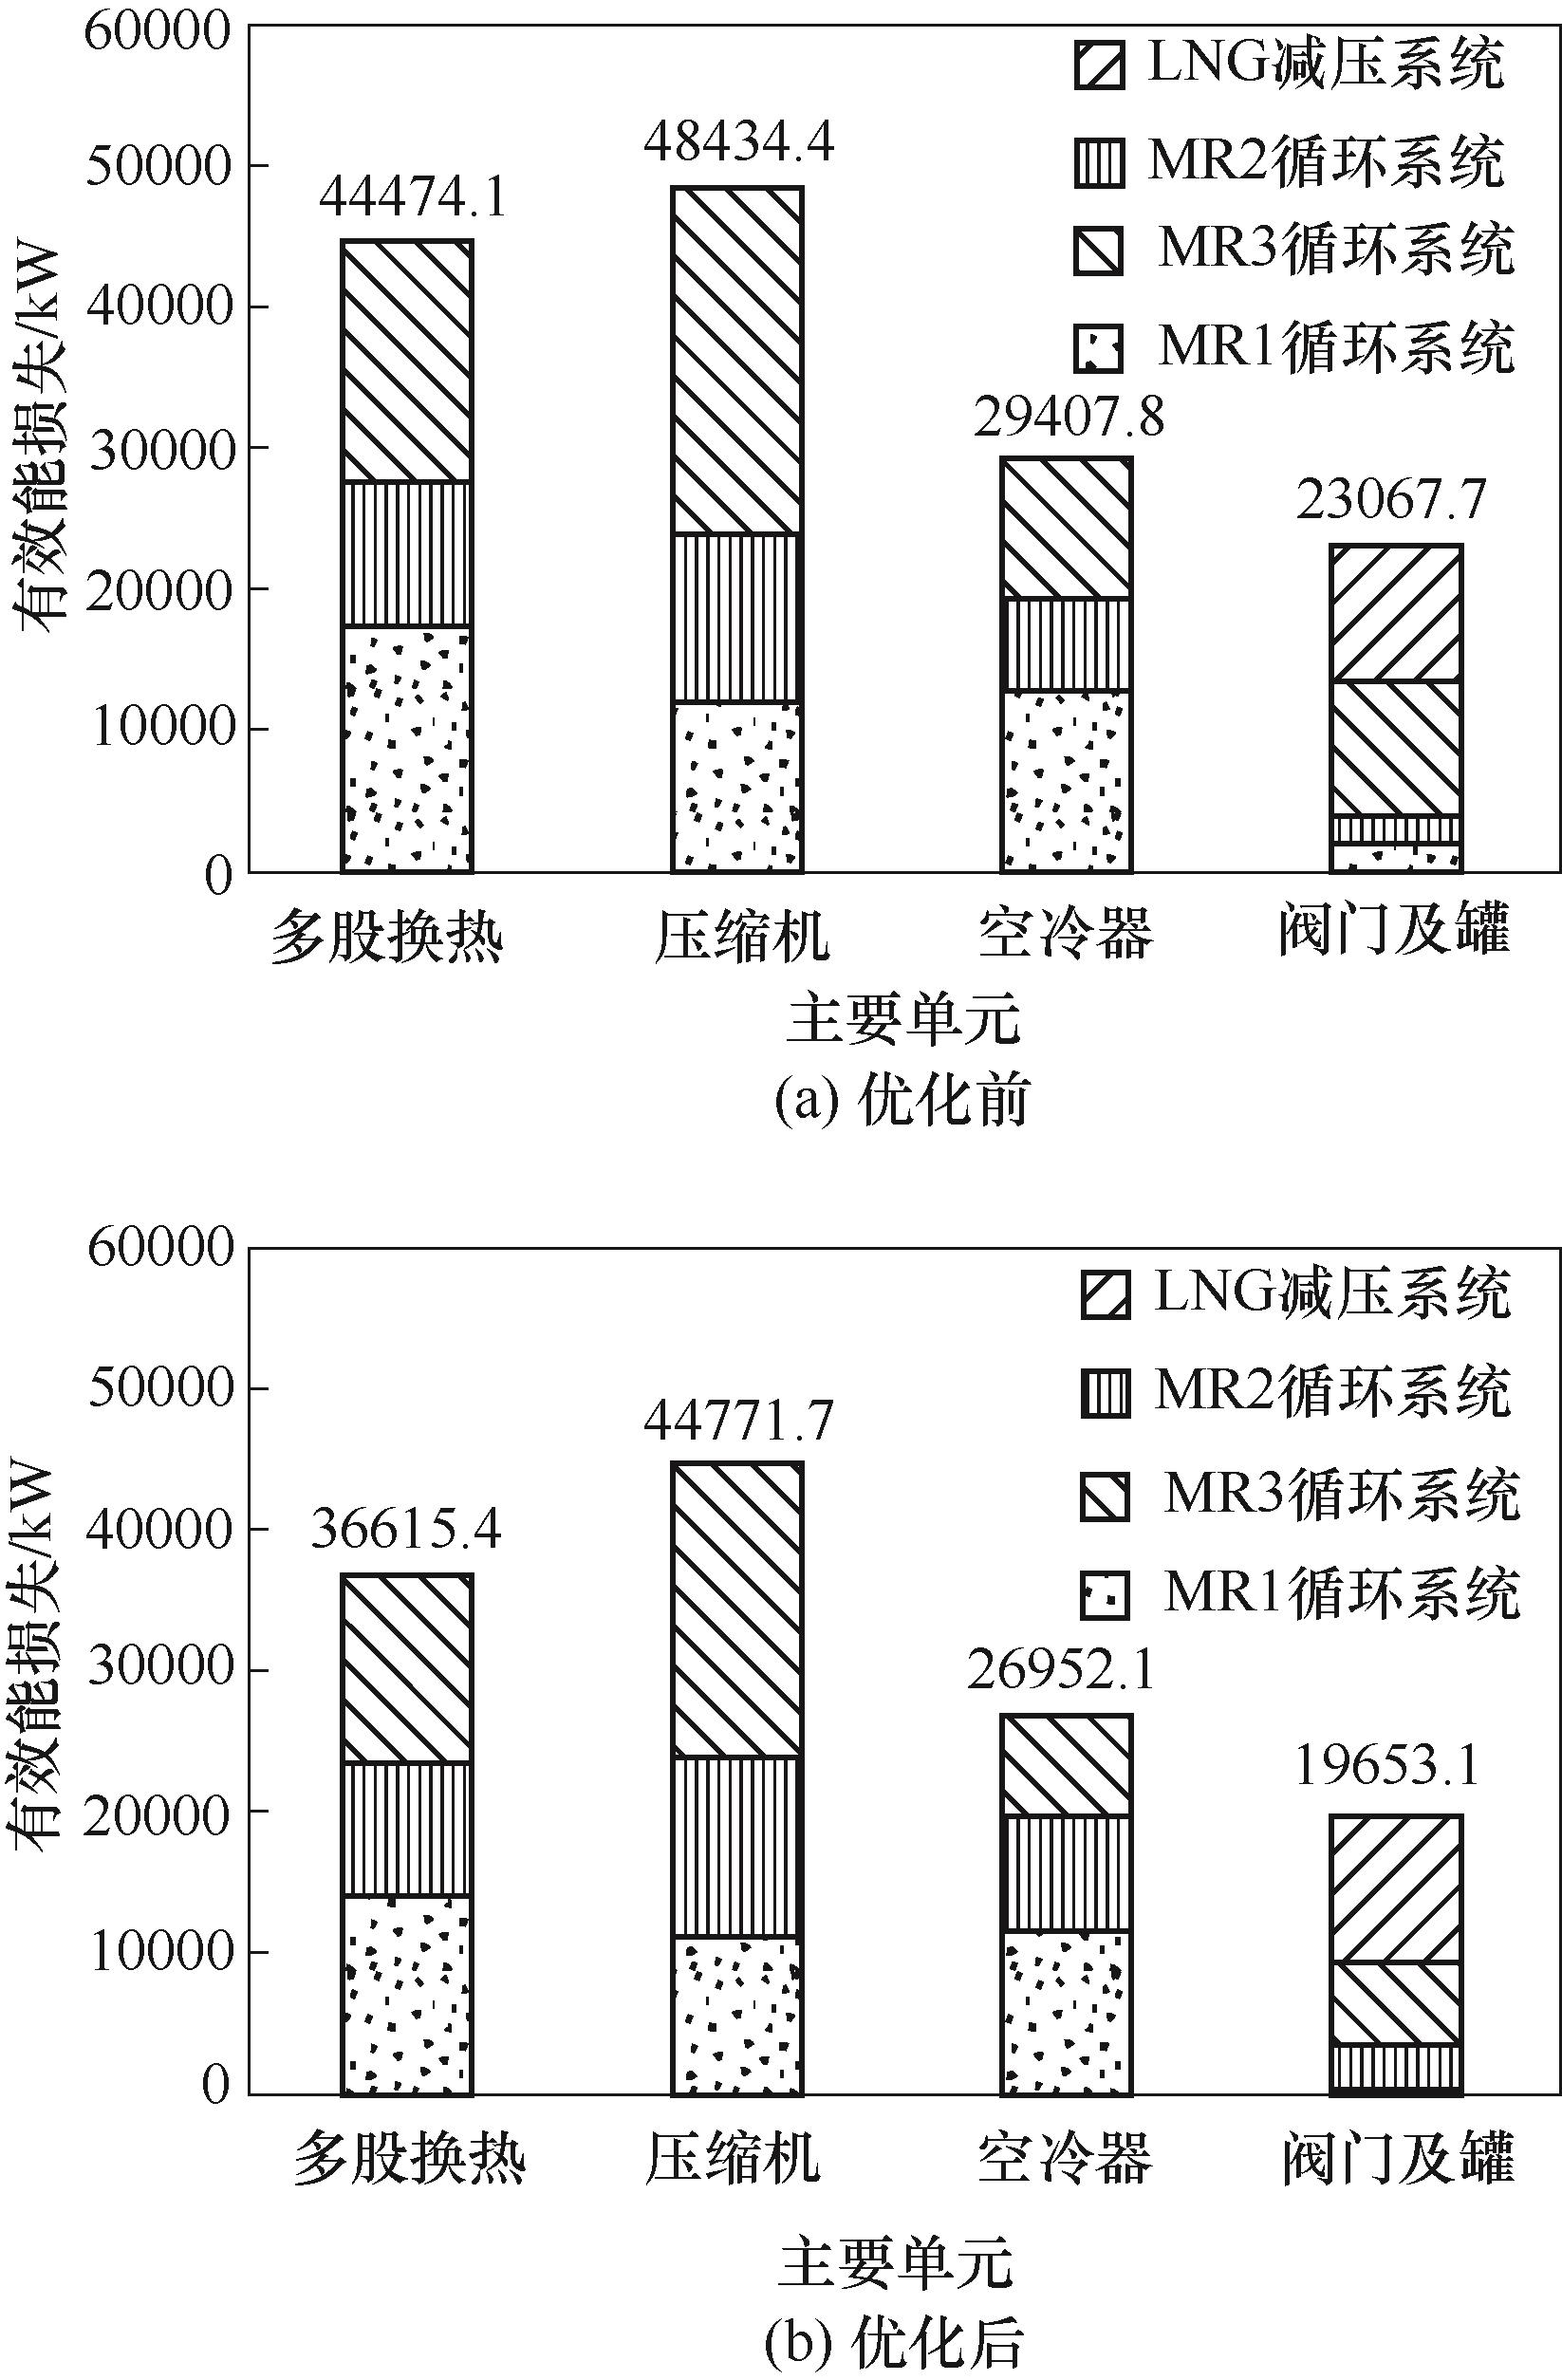
图3 优化前后MFC液化过程各设备及系统的有效能损失对比
Fig.3 Comparison of effective energy loss of each equipment and system in MFC liquefaction process before and after optimization
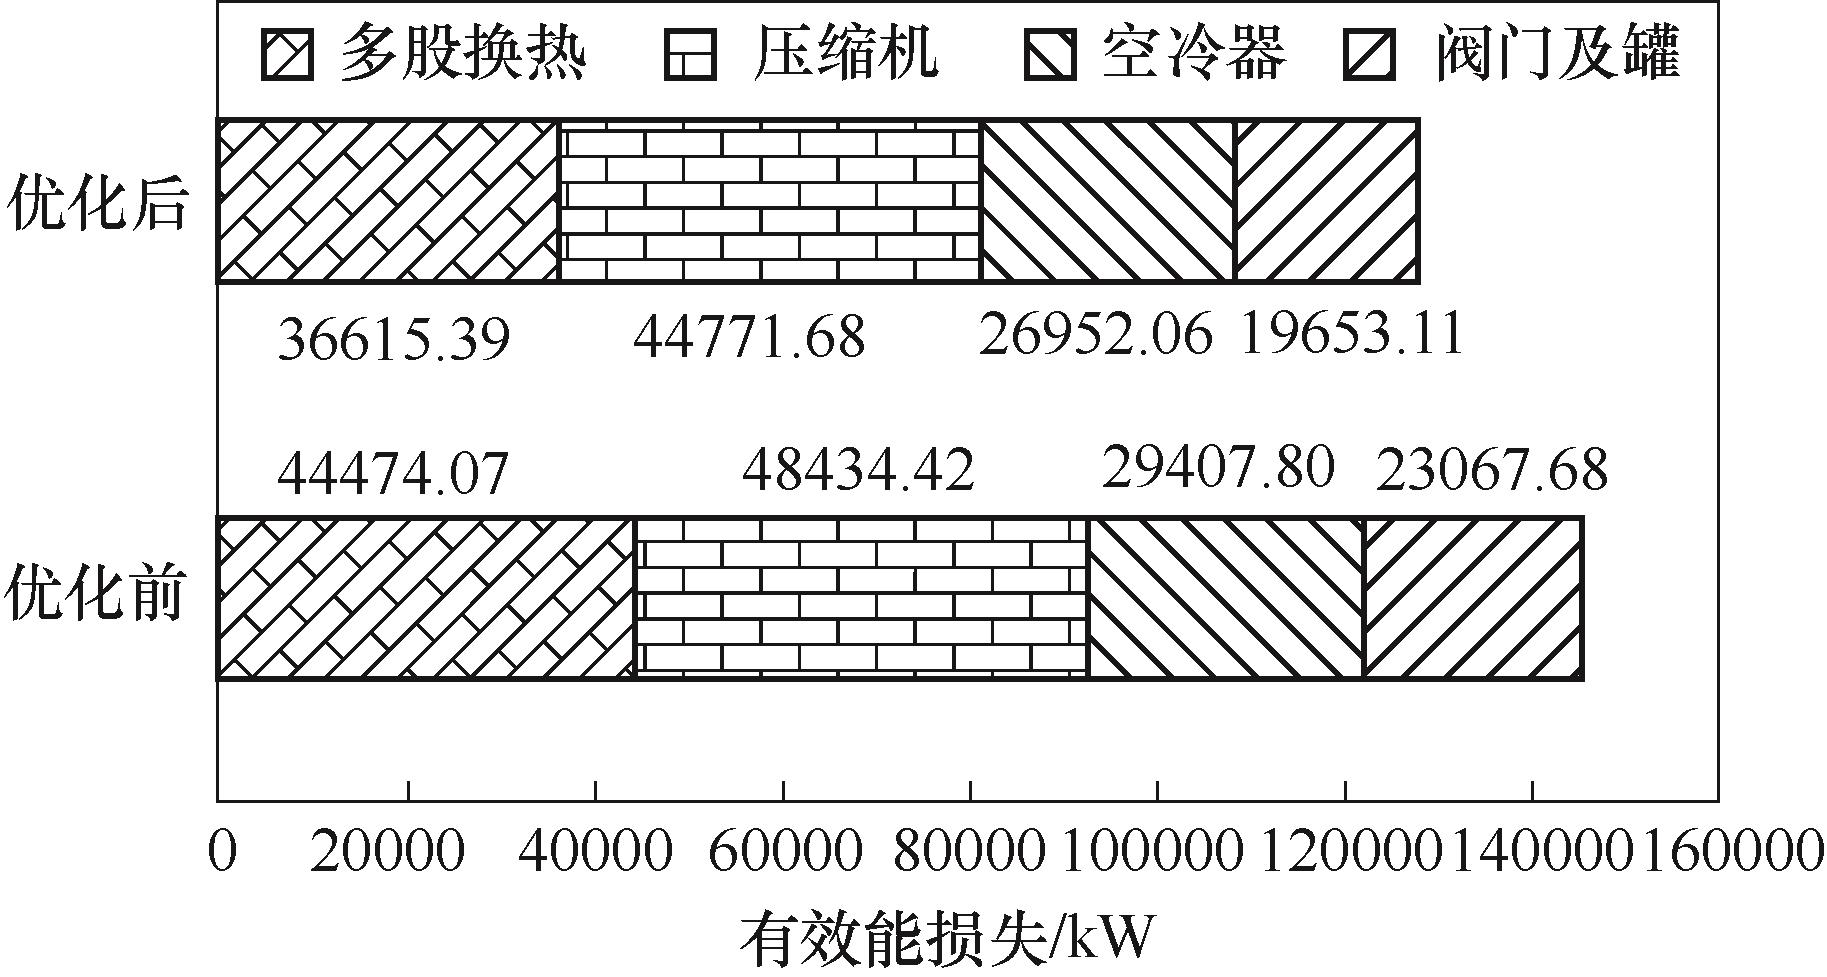
图4 MFC天然气液化工艺优化前后总的有效能损失对比
Fig.4 Comparison of total effective energy loss before and after optimization of MFC natural gas liquefaction process
| 参数 | 单位 | 优化前 | 优化后 | 差值 | 变化率 | 升或降 |
|---|---|---|---|---|---|---|
| 总资本 | USD | 164272000 | 166297000 | 2025000 | 1.2327% | 上升 |
| 公用工程 | USD/a | 172323000 | 165778000 | -6545000 | 3.7981% | 下降 |
| 总运行成本 | USD/a | 195599000 | 188585000 | -7014000 | 3.5859% | 下降 |
| 总设备成本 | USD | 166219800 | 168788900 | 2569100 | 1.5456% | 上升 |
| 总安装成本 | USD | 184817700 | 187397200 | 2579500 | 1.3957% | 上升 |
| 总投资成本 | USD | 515309500 | 522483100 | 7173600 | 1.3921% | 上升 |
| 总生产成本 | USD/a | 367922000 | 354363000 | -13559000 | 3.6853% | 下降 |
表8 优化前后MFC液化过程的经济性分析
Table 8 Economic analysis of MFC liquefaction process before and after optimization
| 参数 | 单位 | 优化前 | 优化后 | 差值 | 变化率 | 升或降 |
|---|---|---|---|---|---|---|
| 总资本 | USD | 164272000 | 166297000 | 2025000 | 1.2327% | 上升 |
| 公用工程 | USD/a | 172323000 | 165778000 | -6545000 | 3.7981% | 下降 |
| 总运行成本 | USD/a | 195599000 | 188585000 | -7014000 | 3.5859% | 下降 |
| 总设备成本 | USD | 166219800 | 168788900 | 2569100 | 1.5456% | 上升 |
| 总安装成本 | USD | 184817700 | 187397200 | 2579500 | 1.3957% | 上升 |
| 总投资成本 | USD | 515309500 | 522483100 | 7173600 | 1.3921% | 上升 |
| 总生产成本 | USD/a | 367922000 | 354363000 | -13559000 | 3.6853% | 下降 |
| 参数 | 单位 | 优化前 | 优化后 | 差值 | 变化率 | 升或降 |
|---|---|---|---|---|---|---|
| 冷公用工程 | kW | 4.269×10⁵ | 4.095×10⁵ | -1.740×10⁴ | 4.076% | 下降 |
| CO2排放 | kg/h | 1.718×10⁵ | 1.648×10⁵ | -0.700×10⁴ | 4.075% | 下降 |
表9 优化前后CO2排放分析
Table 9 Analysis of CO2 emissions before and after optimization
| 参数 | 单位 | 优化前 | 优化后 | 差值 | 变化率 | 升或降 |
|---|---|---|---|---|---|---|
| 冷公用工程 | kW | 4.269×10⁵ | 4.095×10⁵ | -1.740×10⁴ | 4.076% | 下降 |
| CO2排放 | kg/h | 1.718×10⁵ | 1.648×10⁵ | -0.700×10⁴ | 4.075% | 下降 |
| 1 | Howarth R W, Santoro R, Ingraffea A. Methane and the greenhouse-gas footprint of natural gas from shale formations[J]. Climatic Change, 2011, 106(4): 679-690. |
| 2 | Feser J S, Bassioni G, Gupta A K. Effect of naphthalene addition to ethanol in distributed combustion[J]. Applied Energy, 2018, 216: 1-7. |
| 3 | plc Shell. Shell LNG outlook 2024[R]. https://www.shell.com/energy-and-innovation/natural-gas/natural-gas-news-and-publications.html. |
| 4 | Revel D. BP statistical review of world energy [R]. http://www.bp.com/en/global/corporate/about-bp/energy-economics/statistical-review-of-world-energy.html. |
| 5 | Dudley B. BP statistical review of world energy[R]. https://www.bp.com/en/global/corporate/energy-economics/statistical-review-of-world-energy.html. |
| 6 | GU. International gas union world LNG report 2017[R]. http://www.igu.org/news/igu-releases-2017-world-lng-report. |
| 7 | Wood D A. A review and outlook for the global LNG trade[J]. Journal of Natural Gas Science and Engineering, 2012, 9: 6-27. |
| 8 | 范峥, 姬盼盼, 林亮, 等. 天然气液化工艺系统模拟与节能优化[J]. 现代化工, 2018, 38(9): 219-223. |
| Fan Z, Ji P P, Lin L, et al. System simulation and energy saving optimization of natural gas liquefaction process[J]. Modern Chemical Industry, 2018, 38(9): 219-223. | |
| 9 | 林畅, 白改玲, 王红, 等. 大型天然气液化技术与装置建设现状与发展[J]. 化工进展, 2014, 33(11): 2916-2922. |
| Lin C, Bai G L, Wang H, et al. Development and trend of liquefaction technology and construction of large-scale natural gas liquefaction plant[J]. Chemical Industry and Engineering Progress, 2014, 33(11): 2916-2922. | |
| 10 | Qyyum M A, Qadeer K, Lee S, et al. Innovative propane-nitrogen two-phase expander refrigeration cycle for energy-efficient and low-global warming potential LNG production[J]. Applied Thermal Engineering, 2018, 139: 157-165. |
| 11 | Moein P, Sarmad M, Ebrahimi H, et al. APCI-LNG single mixed refrigerant process for natural gas liquefaction cycle: analysis and optimization[J]. Journal of Natural Gas Science and Engineering, 2015, 26: 470-479. |
| 12 | Khan M S, Karimi I A, Lee M. Evolution and optimization of the dual mixed refrigerant process of natural gas liquefaction[J]. Applied Thermal Engineering, 2016, 96: 320-329. |
| 13 | Primabudi E, Morosuk T, Tsatsaronis G. Multi-objective optimization of propane pre-cooled mixed refrigerant (C3MR) LNG process[J]. Energy, 2019, 185: 492-504. |
| 14 | Khan M S, Lee M. Design optimization of single mixed refrigerant natural gas liquefaction process using the particle swarm paradigm with nonlinear constraints[J]. Energy, 2013, 49: 146-155. |
| 15 | Ghorbani B, Mafi M, Shirmohammadi R, et al. Optimization of operation parameters of refrigeration cycle using particle swarm and NLP techniques[J]. Journal of Natural Gas Science and Engineering, 2014, 21: 779-790. |
| 16 | Hwang J H, Roh M I, Lee K Y. Determination of the optimal operating conditions of the dual mixed refrigerant cycle for the LNG FPSO topside liquefaction process[J]. Computers & Chemical Engineering, 2013, 49: 25-36. |
| 17 | Zhang J R, Meerman H, Benders R, et al. Technical and economic optimization of expander-based small-scale natural gas liquefaction processes with absorption precooling cycle[J]. Energy, 2020, 191: 116592. |
| 18 | AspenTech. Aspen Plus: getting started using equation oriented modeling, version number: V8.4[Z]. 2013. |
| 19 | Javaloyes- Antón J, Kronqvist J, Caballero J A. Simulation-based optimization of distillation processes using an extended cutting plane algorithm[J]. Computers & Chemical Engineering, 2022, 159: 107655. |
| 20 | Vikse M, Watson H A J, Kim D, et al. Optimization of a dual mixed refrigerant process using a nonsmooth approach[J]. Energy, 2020, 196: 116999. |
| 21 | Kamath R S, Biegler L T, Grossmann I E. An equation-oriented approach for handling thermodynamics based on cubic equation of state in process optimization[J]. Computers & Chemical Engineering, 2010, 34(12): 2085-2096. |
| 22 | Watson H A J, Khan K A, Barton P I. Multistream heat exchanger modeling and design[J]. AIChE Journal, 2015,61(10): 3390-3403. |
| 23 | Matovu F, Mahadzir S, Ahmed R, et al. Synthesis and optimization of multilevel refrigeration systems using generalized disjunctive programming[J]. Computers & Chemical Engineering, 2022, 163: 107856. |
| 24 | Wang M Q, Zhang J, Xu Q. Optimal design and operation of a C3MR refrigeration system for natural gas liquefaction[J]. Computers & Chemical Engineering, 2012, 39: 84-95. |
| 25 | Lee G C, Smith R, Zhu X X. Optimal synthesis of mixed-refrigerant systems for low-temperature processes[J]. Industrial & Engineering Chemistry Research, 2002, 41(20): 5016-5028. |
| 26 | 郭揆常. 液化天然气(LNG)工艺与工程[M]. 北京: 中国石化出版社, 2014: 103. |
| Guo K C. Liquefied Natural Gas (LNG) Technology and Engineering[M]. Beijing: China Petrochemical Press, 2014: 103. | |
| 27 | Peng D Y, Robinson D B. A new two-constant equation of state[J]. Industrial & Engineering Chemistry Fundamentals, 1976, 15(1): 59-64. |
| 28 | Nawaz A, Qyyum M A, Qadeer K, et al. Optimization of mixed fluid cascade LNG process using a multivariate Coggins step-up approach: overall compression power reduction and exergy loss analysis[J]. International Journal of Refrigeration, 2019, 104: 189-200. |
| 29 | 丁贺, 孙恒, 何明, 等. MFC液化流程的分析和优化[J]. 低温与超导, 2015, 43(9): 1-5. |
| Ding H, Sun H, He M, et al. Analysis and optimization of mixed fluid cascade (MFC) process[J]. Cryogenics & Superconductivity, 2015, 43(9): 1-5. | |
| 30 | 尹全森, 李红艳, 季中敏, 等. 混合制冷剂循环的级数对制冷性能的影响[J]. 化工学报, 2009, 60(11): 2689-2693. |
| Yin Q S, Li H Y, Ji Z M, et al. Effect of number of stages of mixed refrigerant cycle on refrigeration performance[J]. CIESC Journal, 2009, 60(11): 2689-2693. |
| [1] | 王军锋, 张俊杰, 张伟, 王家乐, 双舒炎, 张亚栋. 液相放电等离子体分解甲醇制氢:电极配置的优化[J]. 化工学报, 2024, 75(9): 3277-3286. |
| [2] | 李彦熹, 王晔春, 谢向东, 王进芝, 王江, 周煜, 潘盈秀, 丁文涛, 郭烈锦. 蜗壳式多通道气液旋流分离器结构优化及分离特性研究[J]. 化工学报, 2024, 75(8): 2875-2885. |
| [3] | 李子扬, 郑楠, 方嘉宾, 魏进家. 再压缩S-CO2布雷顿循环性能分析及多目标优化[J]. 化工学报, 2024, 75(6): 2143-2156. |
| [4] | 许茹枫, 陈煜成, 高丹, 焦静雨, 高栋, 王海彬, 姚善泾, 林东强. 离子交换层析分离单抗电荷异质体的模型辅助过程优化[J]. 化工学报, 2024, 75(5): 1903-1911. |
| [5] | 黄志鸿, 周利, 柴士阳, 吉旭. 耦合加氢装置优化的多周期氢网络集成[J]. 化工学报, 2024, 75(5): 1951-1965. |
| [6] | 陈彦松, 阮达, 刘渊博, 郑通, 张帅帅, 马学虎. 微通道换热器拓扑结构优化与性能研究[J]. 化工学报, 2024, 75(3): 823-835. |
| [7] | 曾玉娇, 肖炘, 杨刚, 张意博, 郑光明, 李防, 汪凤玲. 基于机理与数据混合驱动的湿法磷酸生产过程代理建模与优化[J]. 化工学报, 2024, 75(3): 936-944. |
| [8] | 张领先, 刘斌, 邓琳, 任宇航. 基于改进TSO优化Xception的PEMFC故障诊断[J]. 化工学报, 2024, 75(3): 945-955. |
| [9] | 李文俊, 赵中阳, 倪震, 周灿, 郑成航, 高翔. 基于气-液传质强化的湿法烟气脱硫CFD模拟研究[J]. 化工学报, 2024, 75(2): 505-519. |
| [10] | 于嘉朋, 徐娜, 张玮, 康清源, 张鸿, 秦睦轩, 方嘉宾. 微反应器内气液磺化反应收率和能耗建模及多目标优化[J]. 化工学报, 2024, 75(10): 3681-3690. |
| [11] | 从文杰, 黄嘉雯, 范小强, 杨遥, 王靖岱, 阳永荣. 高压法LDPE管式反应器的结构优化方法[J]. 化工学报, 2024, 75(10): 3557-3567. |
| [12] | 余洋, 罗祎青, 魏荣辉, 张文慧, 袁希钢. 考虑节点中断风险的弹性供应链设计方法[J]. 化工学报, 2024, 75(1): 338-353. |
| [13] | 杨欣, 王文, 徐凯, 马凡华. 高压氢气加注过程中温度特征仿真分析[J]. 化工学报, 2023, 74(S1): 280-286. |
| [14] | 陈哲文, 魏俊杰, 张玉明. 超临界水煤气化耦合SOFC发电系统集成及其能量转化机制[J]. 化工学报, 2023, 74(9): 3888-3902. |
| [15] | 齐聪, 丁子, 余杰, 汤茂清, 梁林. 基于选择吸收纳米薄膜的太阳能温差发电特性研究[J]. 化工学报, 2023, 74(9): 3921-3930. |
| 阅读次数 | ||||||
|
全文 |
|
|||||
|
摘要 |
|
|||||
 京公网安备 11010102001995号